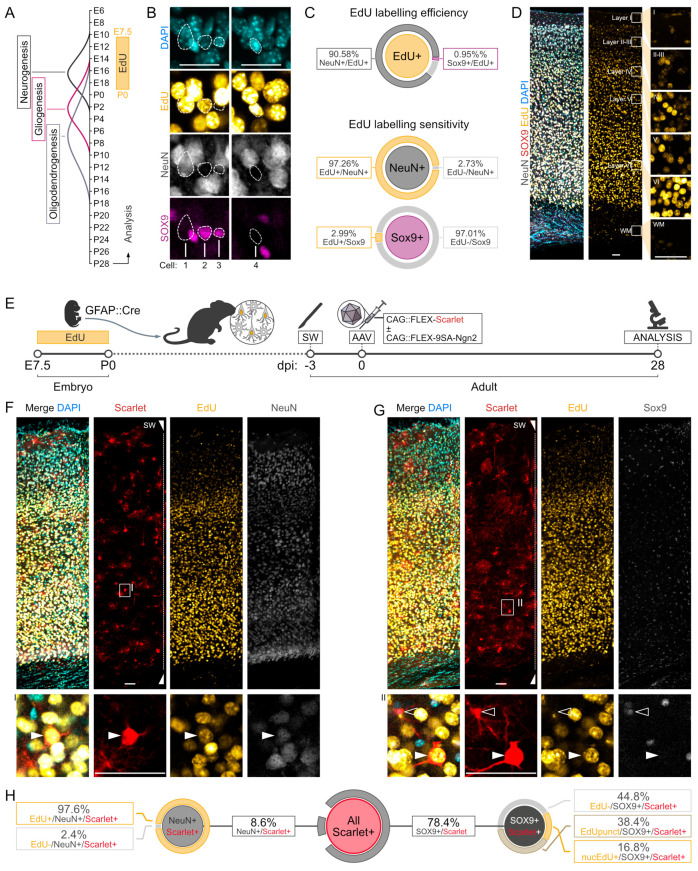
Figure 2.
Chemical lineage tracing of endogenous neurons during FLEX-AAV transduction. (A) Timeline of the generation of the main cell types in the cortex: neurons (E12-E18), astrocytes (E18-P8), and oligodendrocytes (E18-P14). EdU was administered via drinking water between E7 and P0, and cell labelling in the motor cortex was analysed in 28-day-old mice. (B) Representative pictures of EdU-labelled cells in the mouse motor cortex. Astrocytes are marked by Sox9 and neurons by NeuN. Most of the endogenous neurons are labelled by EdU as Cell1, while astrocytes are not like Cell3. EdU rarely labels the nuclei of Sox9+ astrocytes as Cell2, or other unidentified cells as Cell4. Scalebar: 25 μm. (C) Quantification of EdU labelling specificity (top) and efficiency of neurons (middle) and astrocytes (bottom). Graphs show the fraction of cells positive for the marker at the centre of each circle that co-express one or more other markers. Exact mean ± SD values for each class were calculated from three different mice (one brain section each) and are reported on the side. (D) Confocal picture showing the pattern of EdU labelling across the cortical layers of the mouse motor cortex. Layer-specific magnifications are reported in the relative inserts. Scalebar: 50 μm. (E) Scheme illustrating the strategy used to pre-label endogenous neurons with EdU in adult GFAP::Cre mice that were subjected to cortical injury and viral injections. The two surgical procedures were 3 days apart, and mice were sacrificed 28 days after the AAV injection for the analysis. (F,G) Confocal pictures of the mouse motor cortex next to the stab wound injury (SW) 28 days after the AAV injection. Transduced cells are labelled by mScarlet (red) and were co-stained with anti-NeuN (grey in F) and anti-Sox9 (grey in G) to determine their identity, and with Alexa647 via Click chemistry to check the EdU labelling. A single optical plane magnification of an EdU+ neuron is reported in inserts I and II. Scalebars: 50 μm. (H) Quantification of the different cell groups observed in the experiment described in (E–G). mScarlet+ cells were checked for the independent expression of the neuronal marker NeuN and the astrocytic marker Sox9. After that, cells were examined for the presence of EdU. When present in NeuN+ neurons, the EdU signal was only nuclear. Conversely, when Sox9+ astrocytes had an EdU signal, this could have been both nuclear or within somatic puncta. The data in H represent the average of three brain sections coming from the same mouse.

