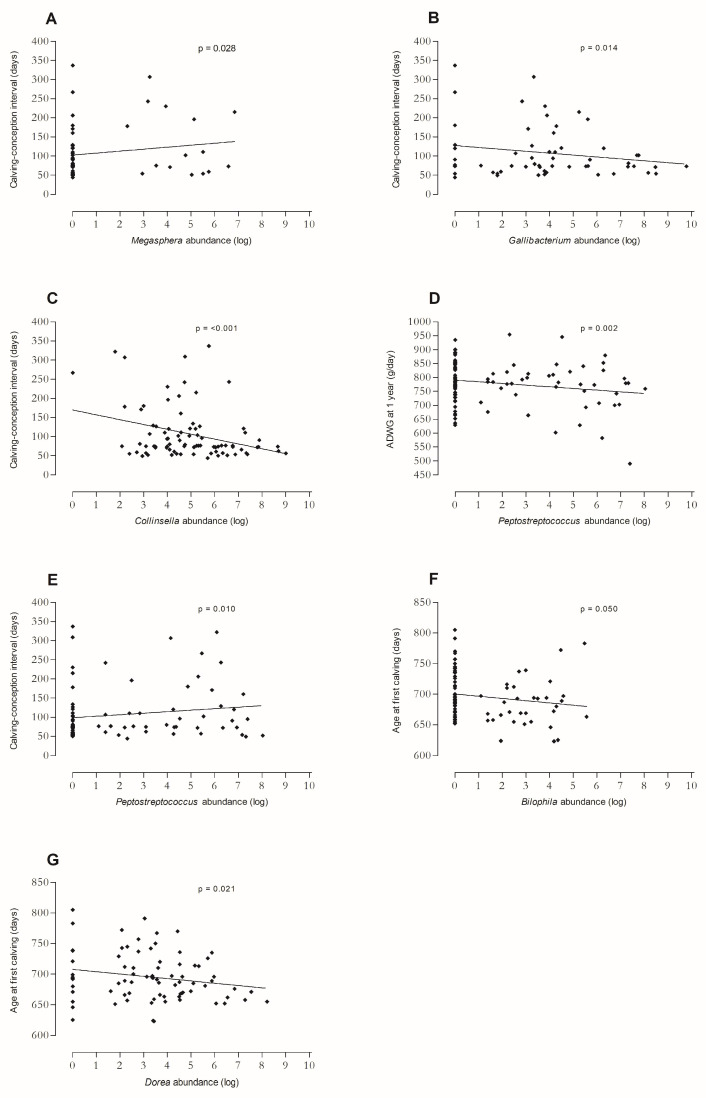
Figure 5.
Associations between logarithmically transformed genera abundances in faecal microbiota of newborn dairy calves and performance outcomes. All associations presented in this figure were statistically significant (p ≤ 0.05), exact p-values can be found in the main text. Univariate linear regression line was included to indicate trend. Model results of multivariate regression can be found in the Supplemental Tables (ST). Megasphaera abundance and calving–conception interval in W1 (ages 1–7 days), negative binomial model (n = 58; (A); Supplemental Table S6). In the same model: Gallibacterium abundance and calving–conception interval in W1 ((B); Supplemental Table S6). Collinsella abundance and calving–conception interval in W2 (ages 8–14 days), negative binomial model (n = 84; (C); Supplemental Table S14). Peptostreptococcus abundance and average daily weight gain (ADWG) in W2, linear regression model (n = 95; (D); Supplemental Table S15). Peptostreptococcus abundance and calving–conception interval in W2, negative binomial model (n = 84; (E); Supplemental Table S14). Bilophila abundance and age at first calving (AFC) in W3 (ages 15–21 days), linear regression model (n = 79; (F); Supplemental Table S20). In the same model: Dorea abundance and AFC in W3 ((G); Supplemental Table S20).

