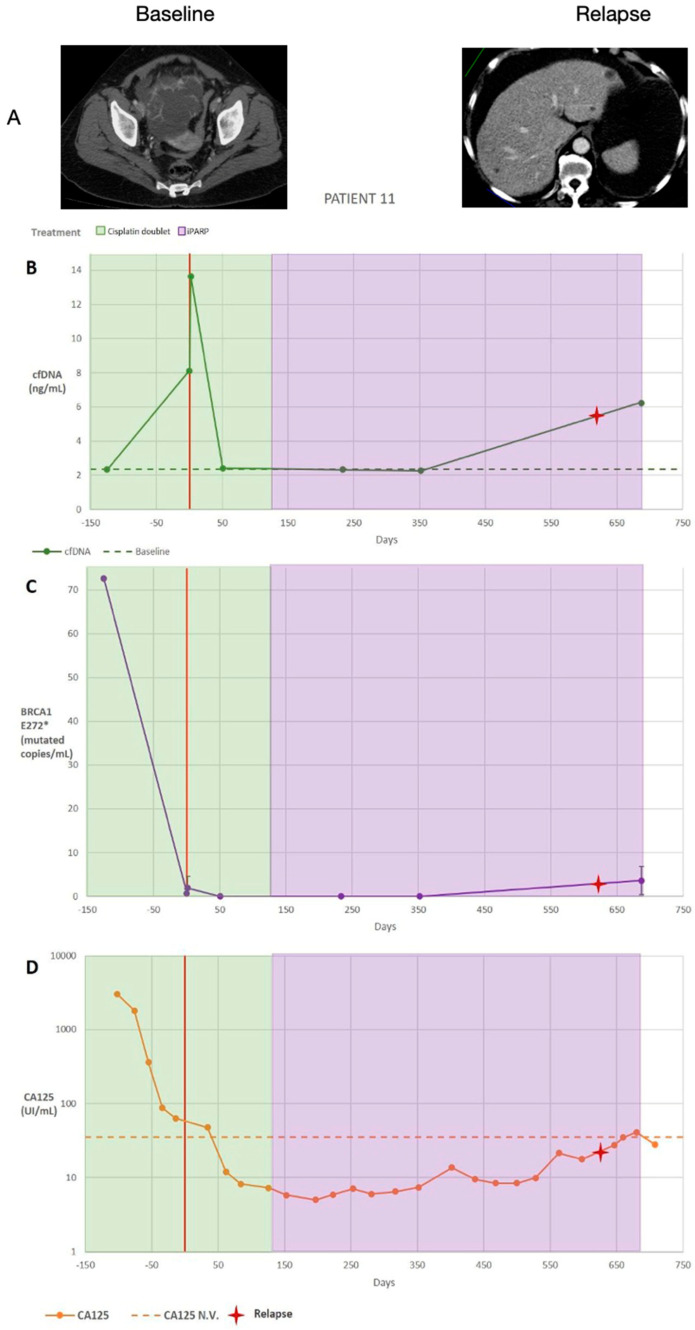
Figure 3.
(A) Summary of patient 11’s clinical information, including the treatment type and dates (treatment dates indicated by the coloured vertical stripes; the date of the cytoreduction surgery is indicated by a red vertical line, and the date of a diagnosed relapse is indicated by a red cross) as well as computed tomography images and summarised results. (B) Cell-free DNA (cfDNA) plasma levels are presented as ng/mL. (C) Circulating tumour DNA (ctDNA) plasma levels are expressed as the number of mutated copies/mL. Replicates were used to quantify the average BRCA1 E272* (c.814 G>T) levels for each time point, and the error bars represent the standard deviation across replicates; no bars indicate that the standard deviation was too low to be visualised on the scale used. The volume-adjusted limit of detection was 21.2 GE/mL for all time points. A two-tailed t-test was used to compare the ctDNA quantities between sequential time points. (D) Cancer antigen 125 (CA125) serum levels (U/mL); data from multiple replicates were not provided. * p < 0.05, ** p < 0.01, and *** p < 0.001.

