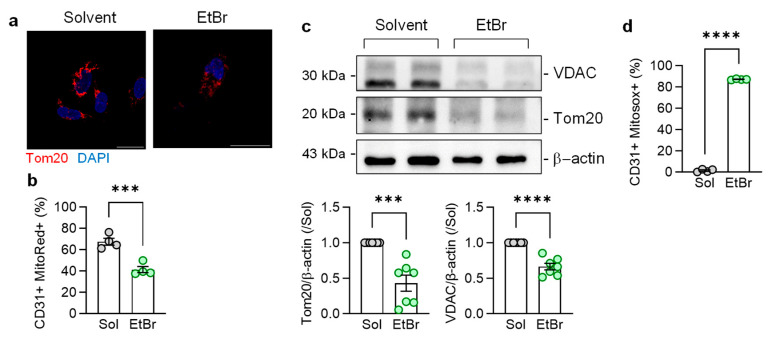
Figure 4.
Consequences of EtBr-induced endothelial cell mitophagy on mitochondrial network integrity and metabolism. (a) Mitochondrial network in endothelial cells cultured in the presence of EtBr for 14 days, as visualized using Tom20. The images were taken 6 h after EtBr washout; bar = 20 µm. Comparable results were obtained in five additional cell batches. (b) FACs-based quantification of mitrotracker red (MitoRed) in CD31+ endothelial cells cultured in the absence and presence of EtBr; n = four independent cell batches (Student’s t test). (c) Expression of VDAC1 and Tom20 in endothelial cells cultured in the presence of solvent or EtBr for 14 days; n = seven independent cell batches (Student’s t test). (d) FACs-based quantification of mitochondrial reactive oxygen species (MitoSox) in CD31+ endothelial cells cultured in the absence and presence of EtBr; n = four independent cell batches (Student’s t test). *** p < 0.001, **** p < 0.0001.

