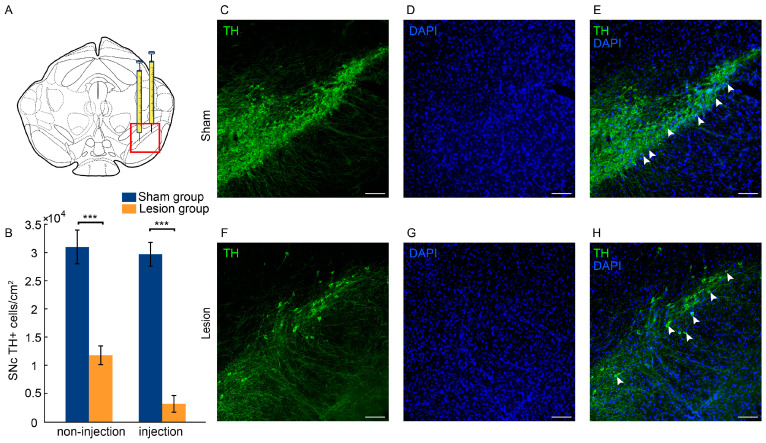
Figure 1.
Dopaminergic cell loss in the SNc after 6-OHDA injection. (A) Schematic representation of injection sites in the SNc, and the subplots C-H show enlarged pictures of the boxed area. (B) The number of TH+ neurons in the SNc for the sham group (n = 10) and the lesion group (n = 10). (C–H) Immunofluorescence staining of TH+ neurons (green, C,F), DAPI (blue, D,G), and a merged image (E,H) of the injection side of the SNc. The white arrows indicate TH+ neurons in the pictures. The scale bar represents 100 μm. All data are expressed as the mean ± SD. *** p < 0.001.

