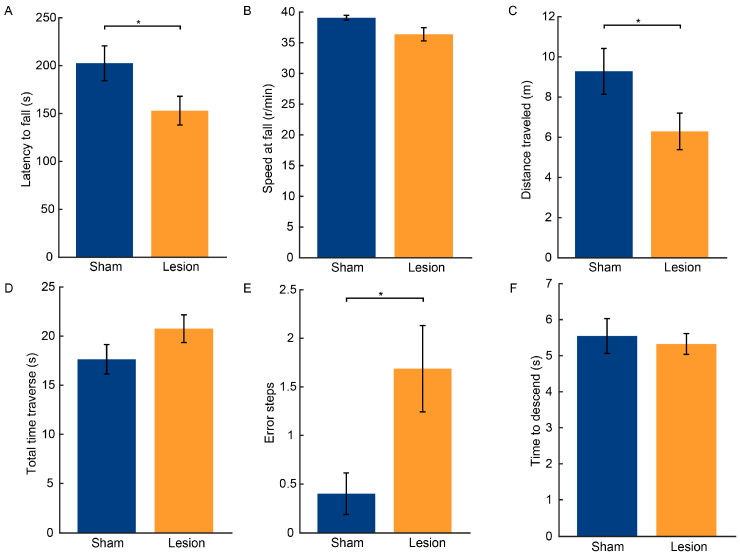
Figure 2.
Behavioral performance of mice after 6-OHDA injection. (A–C) Latency to fall, speed at fall, and total distance traveled in the rotarod test. (D–E) Total time for traversal and number of hindlimb lapses for the balance beam traversal test. (F) Time to descend from top to base in the pole test. n = 16 for the lesion group and n = 15 for the sham group. All data are expressed as the mean ± SD. * p < 0.05.

