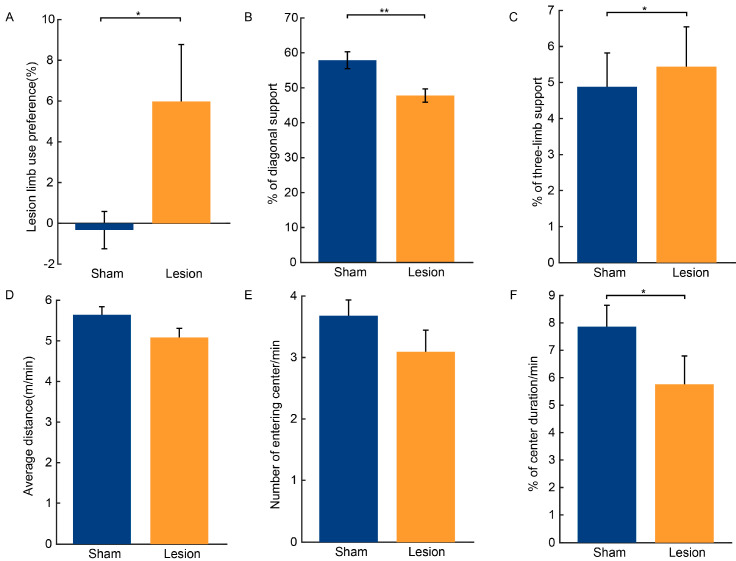
Figure 3.
Limb symmetry, gait impairment, and spontaneous locomotion after 6-OHDA injection. (A) Percentage of forelimb use on the injection side in the rearing cylinder test. n = 16 for the lesion group and n = 12 for the sham group. (B,C) Percentage of diagonal support and three-limb support during locomotion. (D–F) Average distance moved, number of entries into the central area, and percentage of time spent in the central area in the open field test. For pictures (B–F), n = 16 for the lesion group and n = 15 for the sham group. All data are expressed as the mean ± SD. * p < 0.05, ** p < 0.01.

