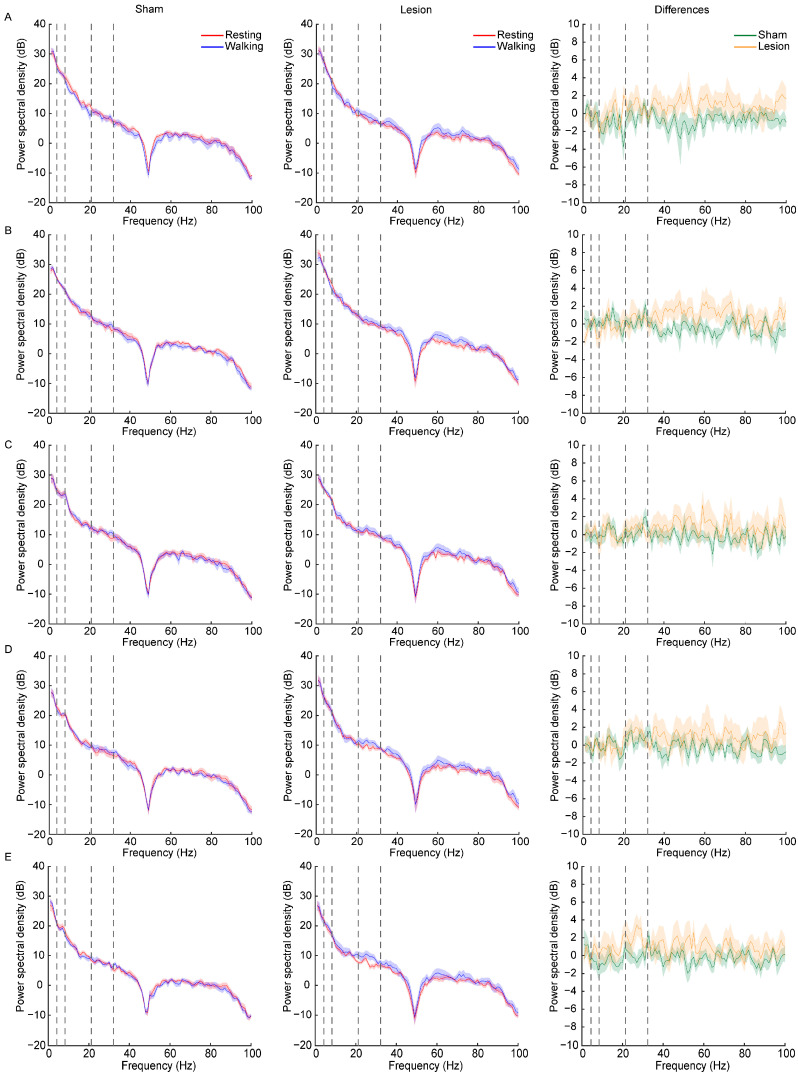
Figure 6.
Power spectral density of LFPs recorded for the M1 (A), CPu (B), STN (C), PPN (D), and SNc (E). Left column shows average power spectral density of sham group during resting (red) and walking (blue) states for each brain region; middle column indicates average power spectral density of lesion group during resting (red) and walking (blue) states for each brain region; right column illustrates differences in power spectral density between walking and resting states in sham group (green) and lesion group (orange). All data are expressed as mean ± SEM. The dotted lines divide the frequency range into the delta (1–4 Hz), theta (4–8 Hz), alpha (8–21 Hz), beta (21–32 Hz), and gamma (32–100 Hz) bands.

