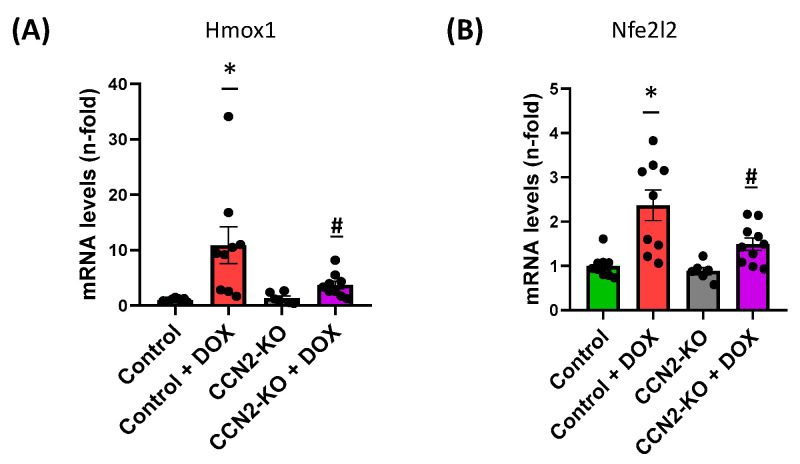
Figure 4.
Gene expression related to oxidative stress in the hearts of studied mice. The expression levels of Hmox1 (A) and Nfe2l2 (B) in the different experimental groups show a significant increase in the Control + DOX group compared to the Control group without DOX treatment. Additionally, for both genes, DOX administration in the absence of CCN2 results in a significant reduction in the increase compared to the Control + DOX group. * p < 0.05 vs. Control; # p < 0.05 vs. Control + DOX. n = 6–10.

