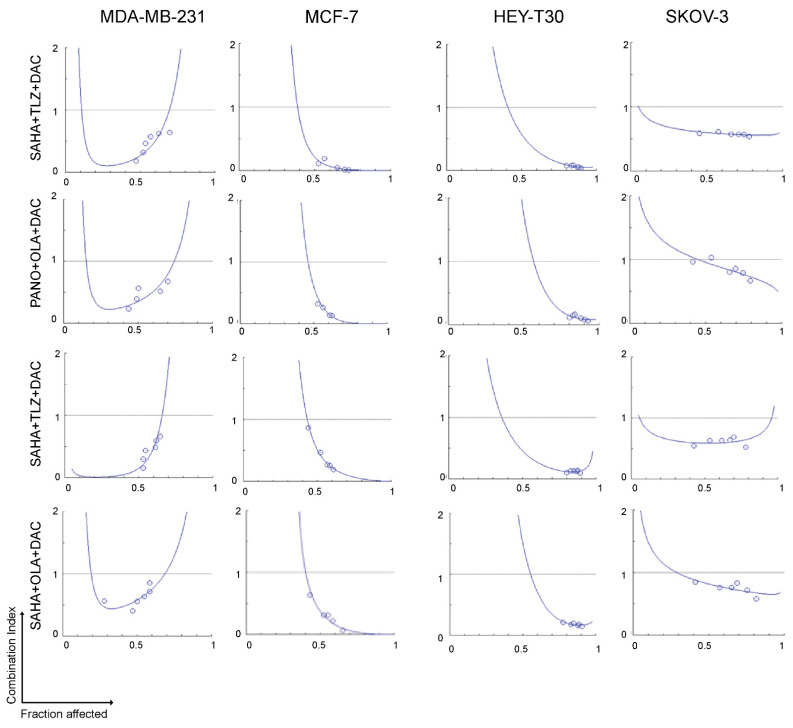
Figure 2.
Synergistic cytotoxicity of HDACi, PARPi, and decitabine. Cells were seeded in 96-well plates overnight and exposed to drugs individually, or in three-drug combinations at a constant concentration ratio, and cell proliferation was analyzed after 3 days. The relationships between the calculated combination indexes (Y-axis) and fractions affected (X-axis) are shown. A combination index < 1.0 indicates synergism. The graphs are representative of two independent experiments.. SAHA: vorinostat; TLZ: talazoparib; DAC: decitabine; PANO: panobinostat; OLA: olaparib.

