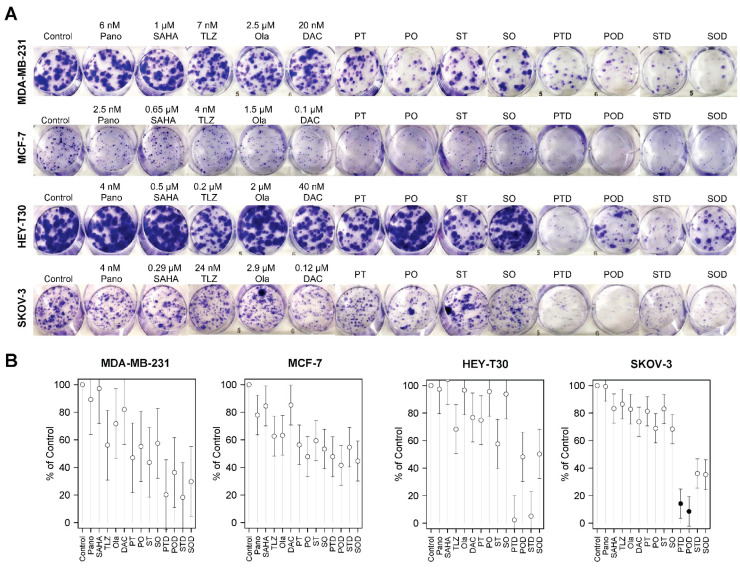
Figure 3.
Colony formation assay. Cells were seeded in six-well plates overnight and exposed to individual drugs or three-drug combinations for 1–2 weeks and stained as described in Methods (A). Colony formation is presented relative to control (B). For the double- and triple-drug combinations, the drug concentrations were the same as indicated in the single-drug concentrations. Model-adjusted means are shown with 95% confidence intervals, and solid points indicate a significant synergistic difference from all of the component drugs (see Supplemental Table S2). Each cell line of each drug was modeled independently. Number of replicates = 3; Pano/P: panobinostat; SAHA/S: vorinostat; TLZ/T: talazoparib; Ola/O: olaparib; DAC/D: decitabine.

