Figure 1.
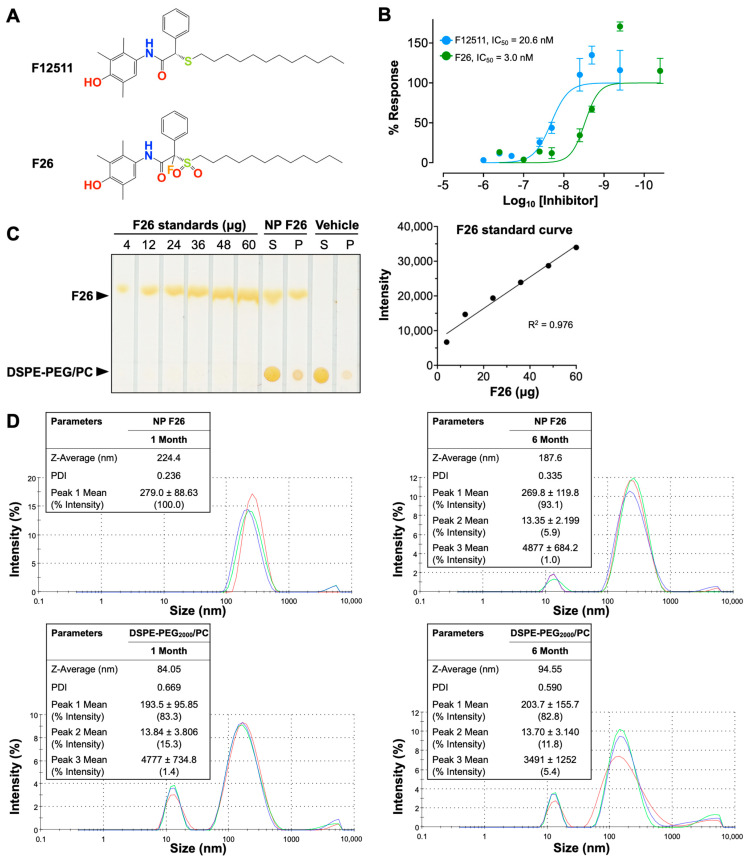
Characterization of F26 and DSPE-PEG2000/PC nanoparticles encapsulating F26 (NP F26). (A) Chemical structures of F12511 (top) and F26 (bottom). (B) Dose–response curves of F12511 and F26 against ACAT in MEFs. The lines show the non-linear fit used to determine the IC50. Each data point represents mean ± SD. (C) F26 encapsulation efficiency in NP F26 was analyzed by TLC with iodine staining (left). The standard curve obtained by plotting the F26 gradient standard (right) and encapsulation efficiency was calculated by using the intensity of the supernatant of NP F26. (D) NP F26 and DSPE-PEG2000/PC nanoparticles were analyzed by a Zetasizer Nano ZS at 1 and 6 months after formulation. All experiments were performed in triplicate, with each measurement represented by a different color line.; peaks are expressed as mean ± SD, and Z-Average and PDI are shown with mean values in the inserted tables. The peak order is by the area under the peak.

