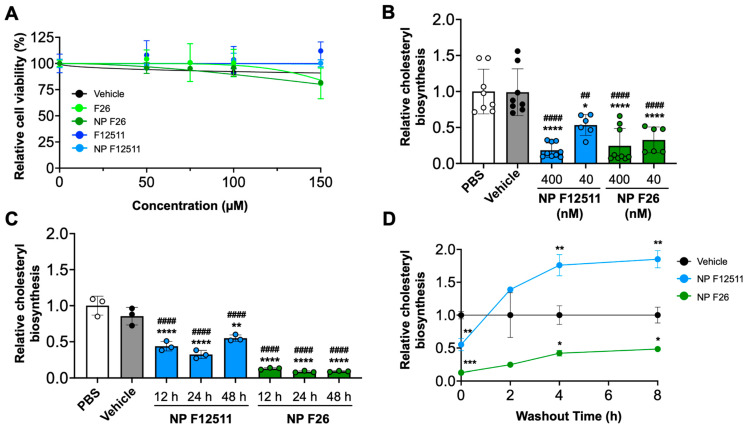
Figure 2.
NP F26 inhibits ACAT1 more strongly and for a longer duration than NP F12511. (A) MEFs treated with graded concentrations of ACAT inhibitors as indicated and nanoparticles were assessed for cytotoxicity via XTT assay. Each data point represents mean ± SEM. (B) Dose-dependent treatments of NP F12511 and NP F26 in MEFs. Cells were treated for 2 h with indicated conditions and then pulsed for another 2 h with 3H-oleate to measure ACAT activities. Bars represent mean ± SD. p-value determined using one-way ANOVA followed by Tukey’s multiple comparisons test. (C) Time-dependent treatments of NP F12511 and NP F26 in MEFs. Cells were treated with 40 nM concentration for indicated time and then pulsed for another 2 h with 3H-oleate to measure ACAT activity. Bars represent mean ± SD. p-value determined using one-way ANOVA followed by Tukey’s multiple comparisons test. (D) MEFs were treated with 40 nM concentration for 2 h with indicated conditions and then washed with drug-free media and incubated for given amounts of time as indicated. ACAT activity was measured by 3H-oleate pulse for 2 h. Each data point represents mean ± SD. p-value determined using two-way ANOVA followed by Tukey’s multiple comparisons test. # showed statistical significance compared to PBS, and * showed statistical significance compared to vehicle. * p < 0.05, ##,** p < 0.01, *** p < 0.001, ####,**** p < 0.0001.

