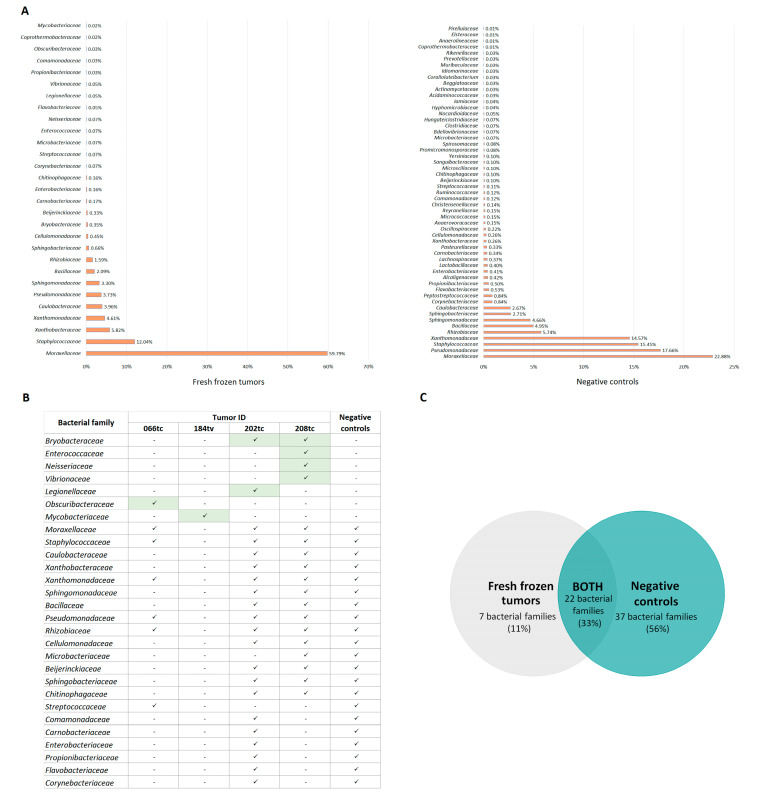
Figure 1.
The profile of bacterial families in fresh frozen HNPGLs and negative controls. (A) Relative abundance of bacterial families in fresh frozen tissues and negative controls. (B) Tumor samples containing bacterial families potentially present in HNPGLs. Green color indicates bacterial families found in tumor samples that were not detected in negative controls. (C) Venn diagram showing the number of common and exclusive bacterial families present in fresh frozen tumors and negative controls.

