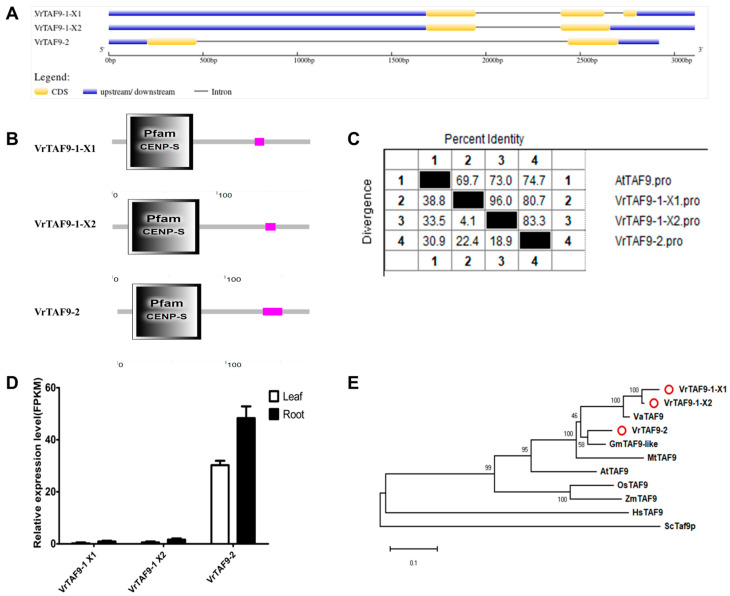
Figure 10.
Multi-analysis of VrTAF9. (A) Gene structures of VrTAF9–1 X1, VrTAF9–1 X2, and VrTAF9–2. (B) Domains analyzed of VrTAF9–1 X1, VrTAF9–1 X2, and VrTAF9–2 by SMART. (C) Sequence identity to AtTAF9. (D) Relative expression levels of VrTAF9–1 X1, VrTAF9–1 X2, and VrTAF9–2 in the leaves and roots of mungbean seedlings. (E) Phylogenetic tree of TAF9 from multi-species (see Figure 2). The red circles indicate the proteins from mungbean.

