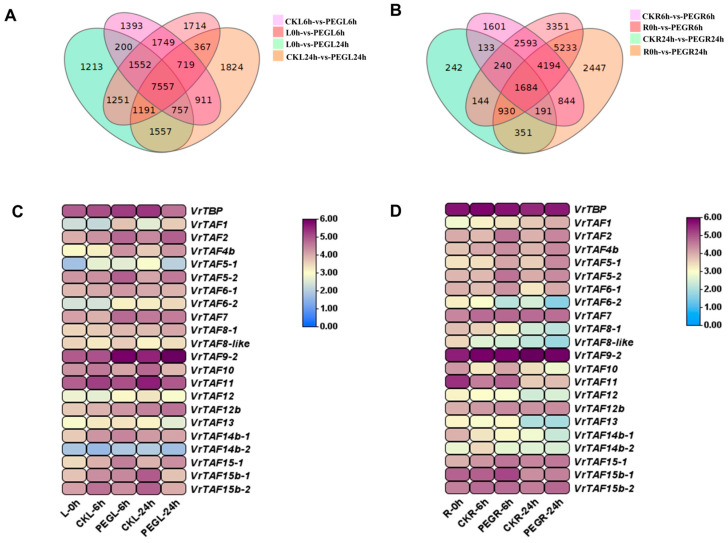
Figure 20.
The expression of VrTBP and VrTAFs responding to water-deficit stress. (A) Venn diagram representing all relationships between the four groups of genes in leaves responding to water-deficit stress: L0h-vs-PEGL6h (pink), L0h-vs-PEGL24h (green), CKL6h-vs-PEGL6h (light purple), and CKL24h-vs-PEGL24h (orange). (B) Venn diagram representing all relationships between the four groups of genes in roots responding to water-deficit stress: R0h-vs-PEGR6h (pink), R0h-vs-PEGR24h (orange), CKR6h-vs-PEGR6h (light purple), and CKR24h-vs-PEGR24h (green). (C) The heat map of VrTBP and VrTAFs in leaves under water-deficit stress. (D) The heat map of VrTBP and VrTAFs in roots under water-deficit stress. Values (RNA-seq data) FPKM are used as the logarithm (LOG 2) for the heat map. L: leaf; R: root.

