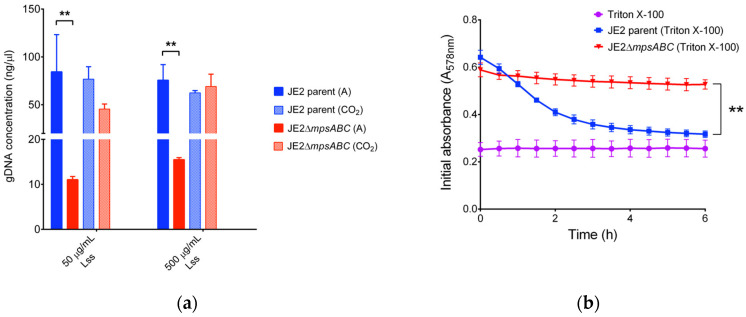
Figure 3.
JE2ΔmpsABC cells are more resistant to lysis. (a) Concentration of genomic DNA (gDNA) released upon cell lysis from JE2 parent and its ΔmpsABC grown under ambient air and 5% CO2 following treatment with lysostaphin (Lss). Genomic DNA was isolated using the commercial Quick-DNATM Microprep Kit (ZYMO Research, Germany) according to the manufacturer’s protocol. Significantly less gDNA was isolated from the mutant than from the parent strain. Each bar in the chart shows the mean ± standard deviations (SD) from three independent biological replicates. Significance was calculated by two-way ANOVA with (** p < 0.01). The concentration of released gDNA upon cell lysis is listed in Table S1. (b) Triton X-100 induced autolysis assay. Triton X-100 (0.05% in PBS) was added at 0 h to mid-exponential phase cells. Autolysis was monitored by measuring the decrease in absorption (A578) every 30 min for 6 h (** p < 0.01 as determined by unpaired two-sided t-test). Triton X-100 alone served as negative control. Each value in the graph represents the mean ± standard deviations (SD) from three independent biological replicates.

