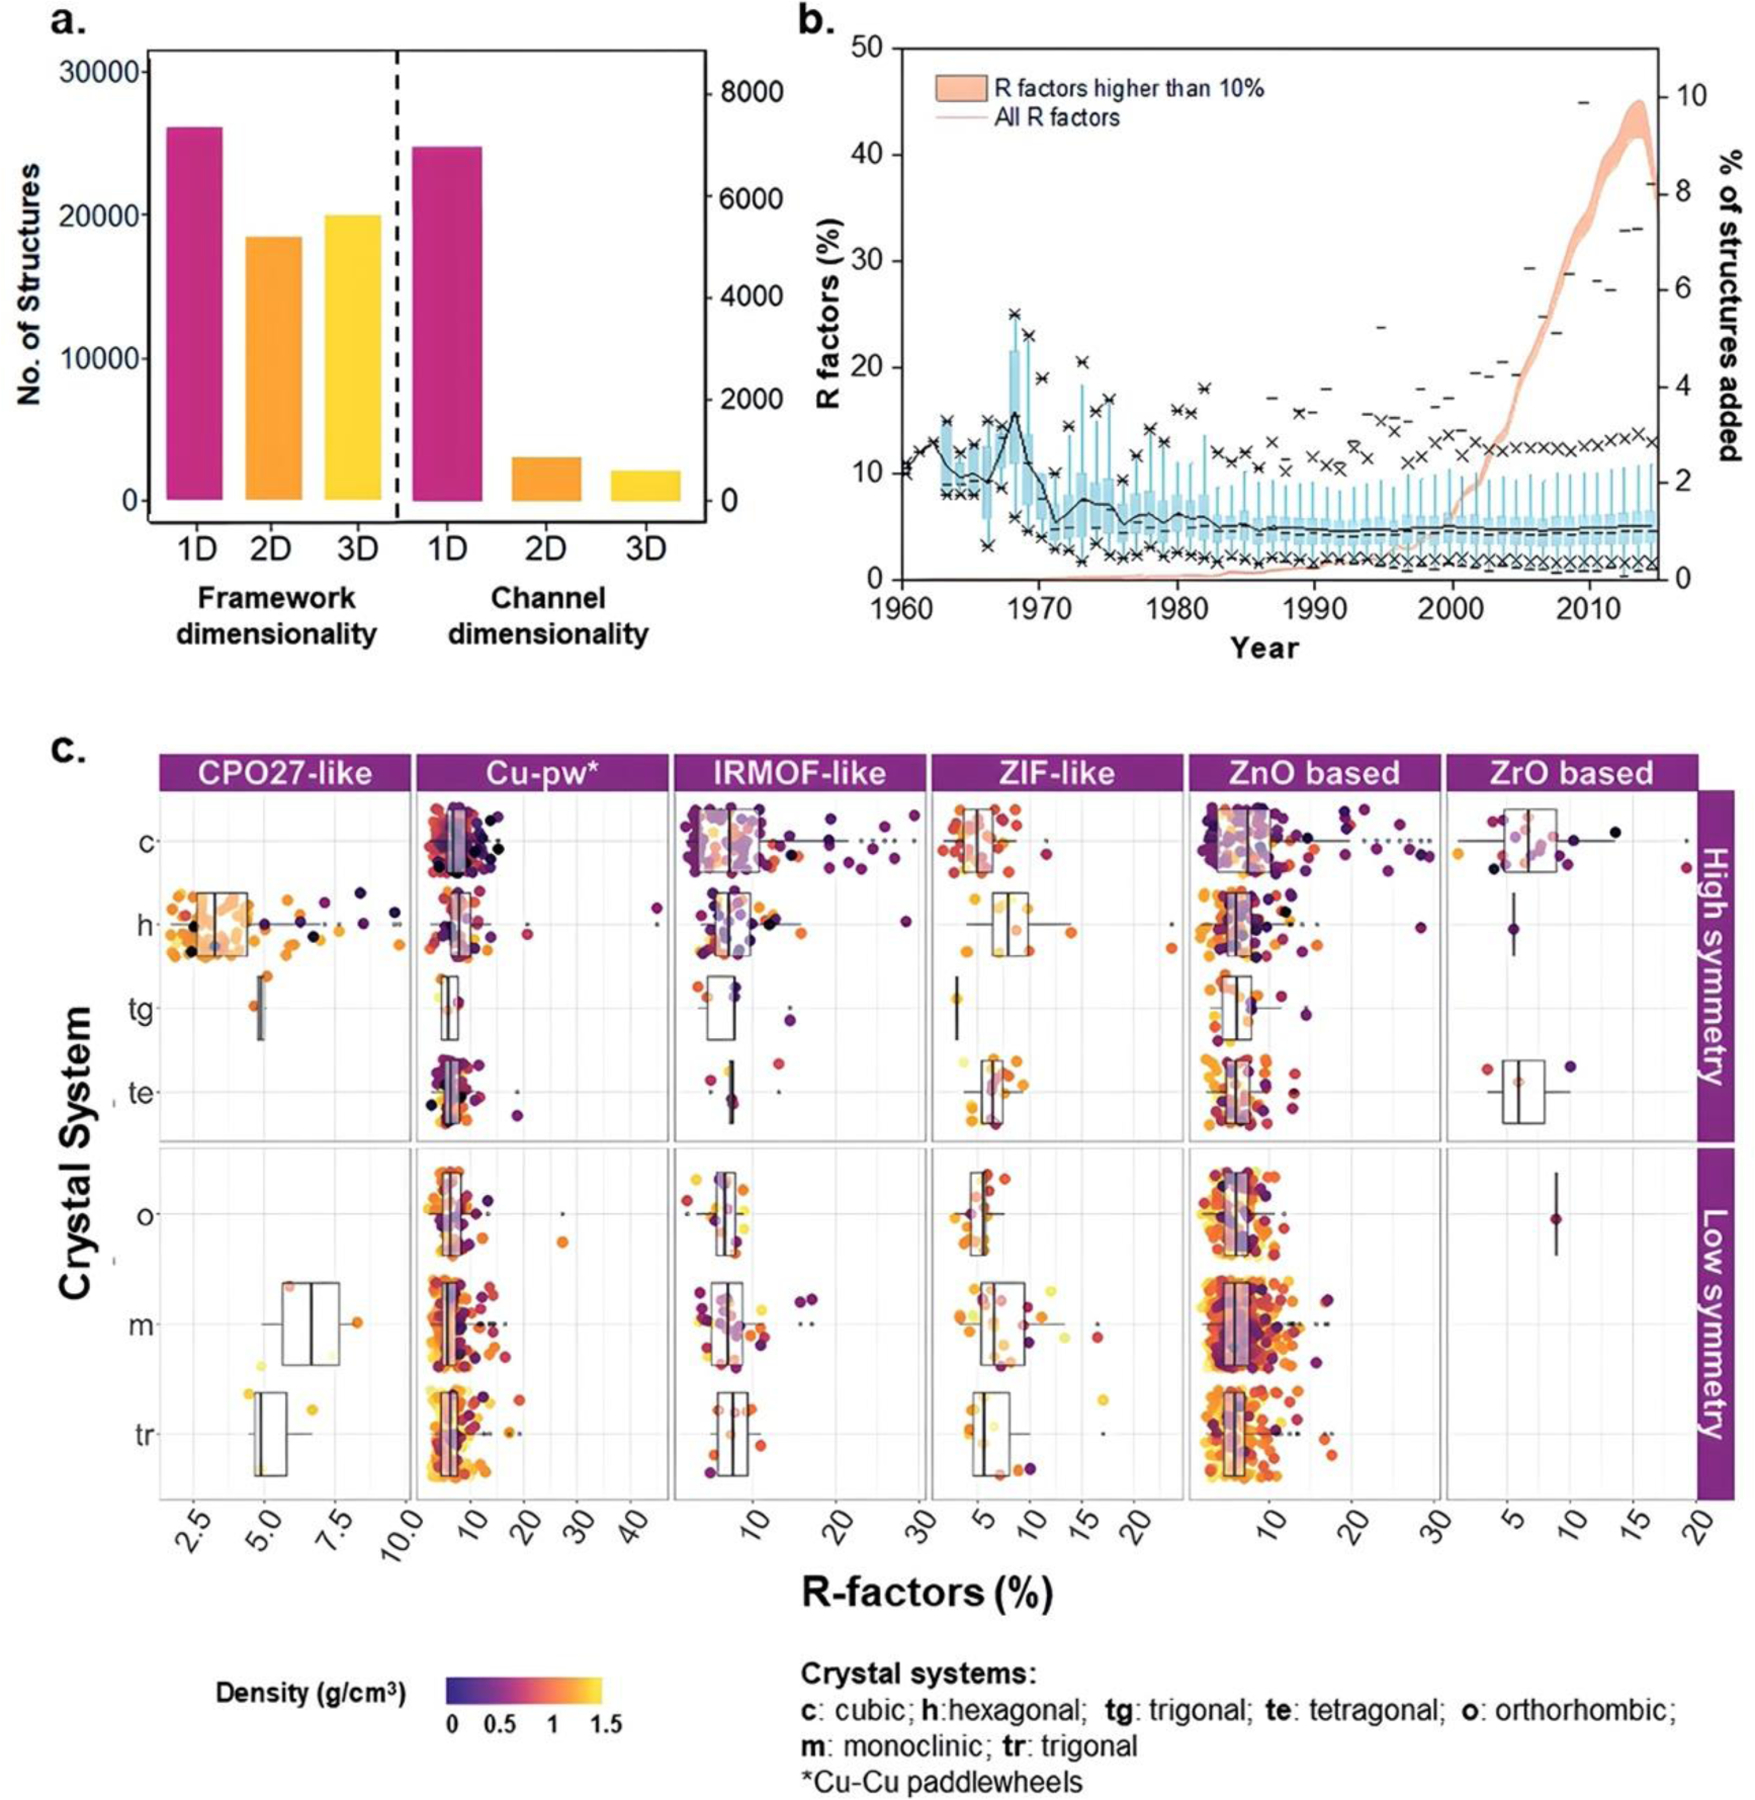
Figure 4. Analysis of MOFs within the Cambridge Structural Database (CSD).

(a) Histograms display the dimensionalities of frameworks and channels/pores for the dataset of 52,787 structures. (b) The non-cumulative evolution of R factors for the MOF subset from 1960 to 2015 is depicted. Boxplots in blue represent the distribution of R factors per year, with percentiles indicated by different symbols. A black line connects the means across the boxes, and the orange curve represents the percentage of structures added to the database each year. The orange area under the curve highlights the number of structures with an R factor exceeding 10%. (c) The distribution of R factors and density is presented for different MOF families and crystal systems categorized by low or high symmetry. Reproduced from Ref. [21] with permission from the Royal Society of Chemistry [12–21].
