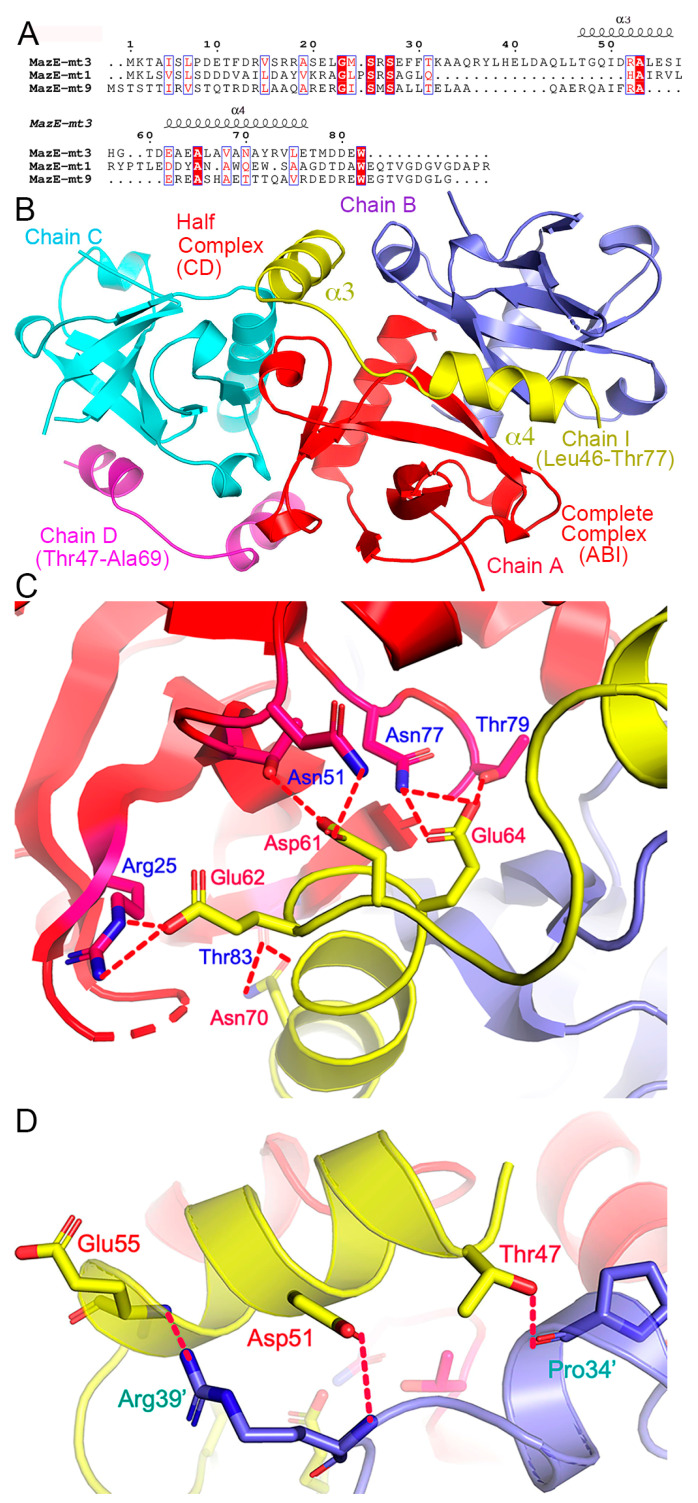
Figure 3.
Overall structure of the MazEF-mt3 TA complex. (A) The multiple sequence alignment of MazE-mt3, -mt1 and -mt9 and the secondary structure elements of MazE-mt3 were indicated on the top of the alignment (based on the structure of PDB 8ZWS). Identical residues in sequences are on a red background, and similar residues are in red. (B) The MazF-mt3 assembly in the asymmetric unit in the ribbon rendition. The complete and half complexes are labeled. The two fragments of MazE-mt3 are colored yellow and magenta, respectively. (C,D) Close-up view of the TA complex interface at the Asp61-Glu64 fragment (C); and at the α3-helix (D). The side chains of the key interfacial residues are shown as sticks and labeled. The hydrogen-bonding and salt-bridge interactions are indicated by the red dashed lines (cutoff distance: 3.65 Å).

