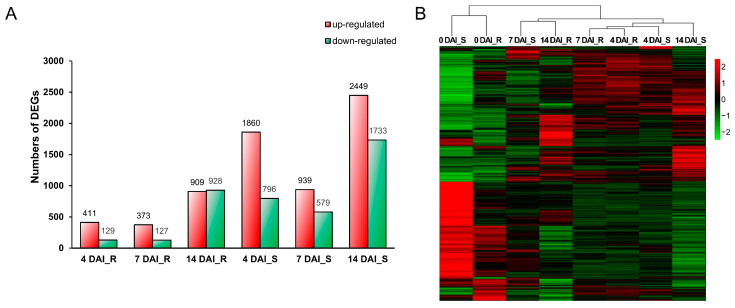
Figure 1.
Transcriptomic response profiling in B. oleracea roots following inoculation with P. brassicae. (A) Histogram of number of up- or down-regulated DEGs. The red box represents the number of up-regulated genes; the green box represents the number of down-regulated genes. (B) Heatmap of all DEGs of R and S pools at different infection stages compared to 0 DAI. DAI, days after inoculation. R, resistant pool. S, susceptible pool.

