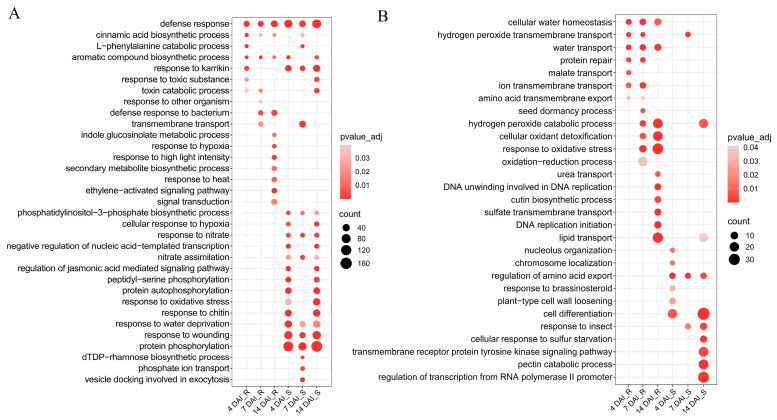
Figure 2.
GO enrichment analysis of the differentially expressed genes in R and S pools at different infection stages compared to 0 DAI. (A) The GO significant enrichment analysis of up-regulated genes. (B) The GO significant enrichment analysis of down-regulated genes. The y-axis corresponds to the enriched GO terms, while the x-axis represents the varying time points post-inoculation for both R and susceptible S pools. The size of each dot indicates the number of genes enriched for each term, and the color of each dot signifies the adjusted p-value, representing the significance of each term. DAI, days after inoculation. R, resistant pool. S, susceptible pool.

