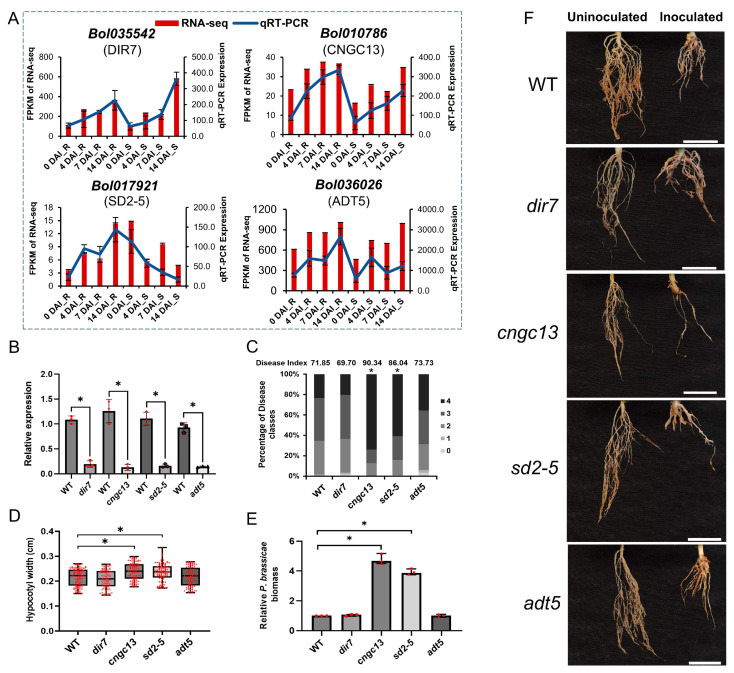
Figure 5.
Validation of candidate genes through qRT-PCR and identification of clubroot resistance. (A) The expression levels of the four genes measured by RNA sequencing and qRT-PCR. (B) Relative gene expression in WT and T-DNA mutant lines of four candidate genes in A. thaliana at 28 DAI by P. brassicae. (C) Disease index and percentages of WT and four mutant lines in the individual disease classes. Disease index = (1 × n1 + 2 × n2 + 3 × n3 + 4 × n4) × 100/4Nt, where n1–4 represents the number of plants in each severity class, and the total number of plants tested is denoted as Nt. (D) Hypocotyl width of WT and four mutants at 28 DAI by P. brassicae. (E) The P. brassicae biomass of root among WT and four mutants at 28 DAI by P. brassicae. (F) Root symptoms of WT and four mutants at 28 days after uninoculated and inoculated by P. brassicae. Treatments were replicated three times with 34–45 plants per replicate. White bar: 1 cm. The asterisk indicates a significant difference at p-value ≤ 0.01.

