Figure 3.
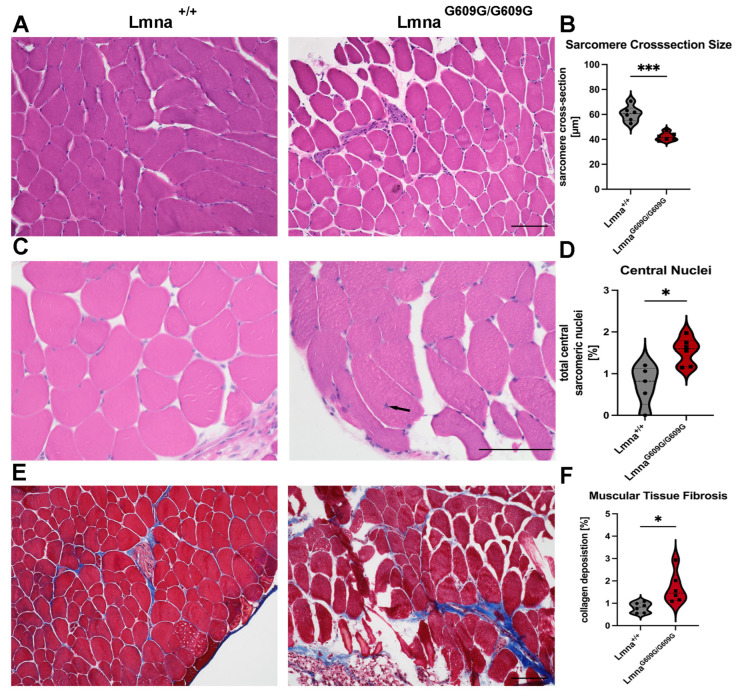
Histological and Immunofluorescent characterization of muscular (gastrocnemius) pathology in LmnaG609G/G609G mice compared to wildtype C57B/6 mice: (A) H&E staining used to quantify sarcomere diameter in transversal gastrocnemius muscle cuts showing reduced size in LmnaG609G/G609G mice (n = 6; *** p < 0.0005; scale bar = 100 µm). (B) Graphic showing sarcomere size cross-section variation comparing Lmna+/+ and LmnaG609G/G609G mice. (C) Nuclear position was assessed in HE-stained pictures showing elevated levels of central nuclei mislocalization in LmnaG609G/G609G mice. Dark arrow shows location of a central nucleus in LmnaG609G/G609G mice (n = 6; * p < 0.05, scale bar = 100 µm). (D) Graphic showing central nucleus occurrence comparing Lmna+/+ and LmnaG609G/G609G mice. (E) Masson’s Trichrome staining indicating muscular fibrosis. Fibrosis was increased in muscular vasculature and in the perimuscular space of LmnaG609G/G609G mice (n = 6; * p < 0.05; scale bar = 100 µm). (F) Graphic showing percentage of collagen deposition in muscular tissue comparing Lmna+/+ and LmnaG609G/G609G mice.

