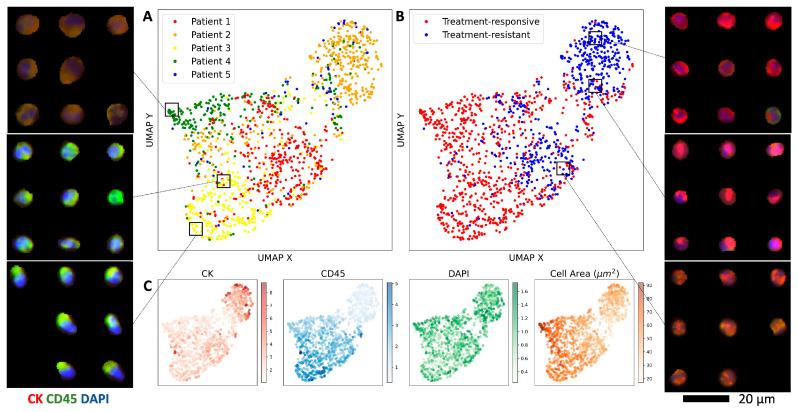
Figure 4.
Treatment-resistant CHCs are phenotypically distinct from treatment-responsive CHCs. (A) UMAP of the β-VAE CHC embeddings colored by patient. (B) The same UMAP of the β-VAE CHC embeddings stratified by treatment response or resistance. (C) Relevant feature distributions across the UMAP, including normalized CK/CD45/DAPI expression and cell area. (Inset) CHC images plotted in the UMAP space reveal clusters with distinct morphological and staining characteristics.

