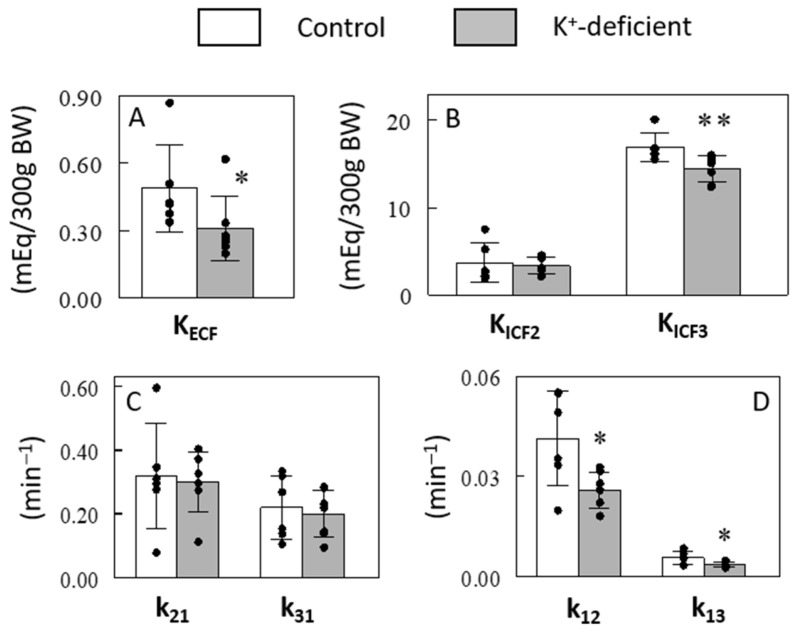
Figure 6.
Effects of a 10-day K+ restriction on 3-C model estimated sizes of ECF (A) and ICF (B) K+ pools and rate constants for K+ fluxes into and out of the fast (C) and slow (D) ICF K+ pools. Data are means ± SD (n = 6 for control and 7 for K+-deficient rats). The bars and the error bars indicate means and SDs, respectively. *, p < 0.05; **, p < 0.01 vs. control.

