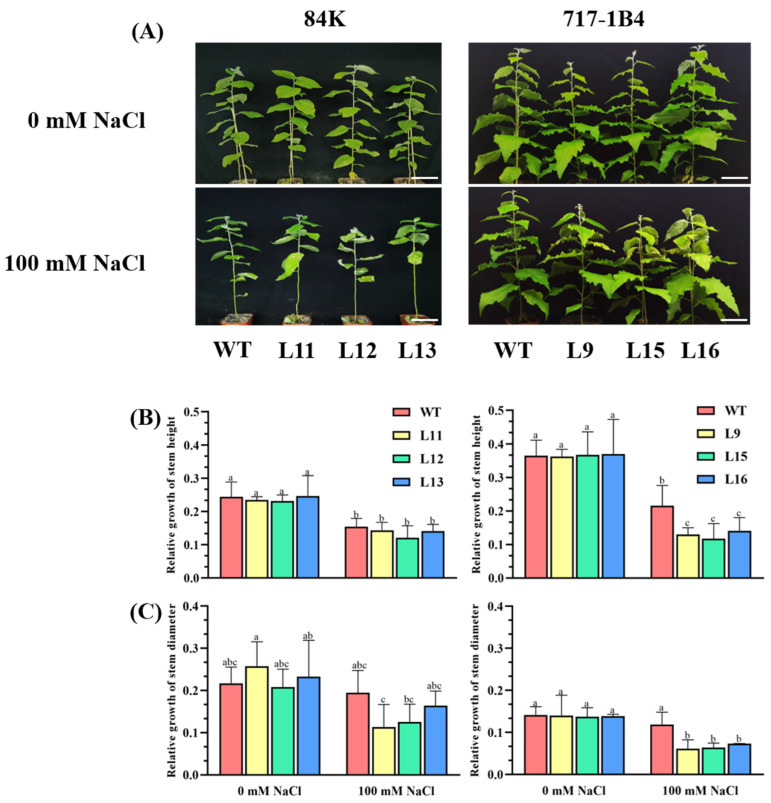
Figure 4.
Phenotypic tests of the wild-type (WT) and PtEXPA6-overexpressing lines of 84K and 717-1B4 under long-term salt stress. The PtEXPA6-overexpressing lines of 84K (L11, L12, and L13) and 717-1B4 (L9, L15, and L16), and wild-type (WT) were exposed to NaCl with 0 or 100 mM for 15 days. The stem height and diameter of the no-salt control and salinized plants were measured after 15 days of the salt treatment. The relative growth of the stem height and diameter during the observation period are shown. (A) Representative images showing plant performance after the salt treatment. Scale bars = 5 cm. (B) Relative growth of the stem height. (C) Relative growth of the stem diameter. The data are means ± SD (n = 3), and the bars with different letters indicate significant differences (p < 0.05).

