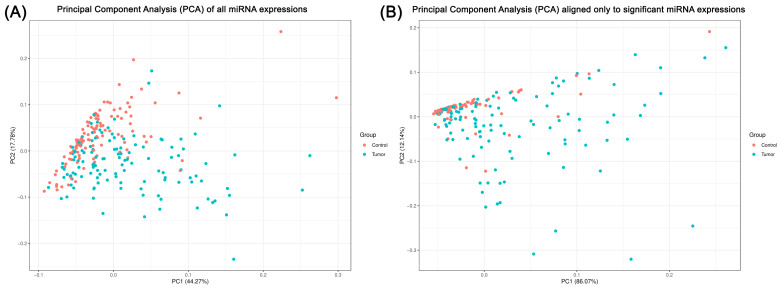
Figure 5.
Comparative principal component analysis of miRNA expressions in tumor and control samples. In plot (A), a PCA of all miRNA expressions tested is shown, with the horizontal axis representing Principal Component 1 (PC1), which accounts for 44.27% of the variance, and the vertical axis representing Principal Component 2 (PC2), accounting for 17.78% of the variance. Variables of the control group are marked in red and the tumor group in blue, indicating moderate separation along PC1, suggesting differential expression patterns between the two states. Plot (B) however displays a PCA focused exclusively on miRNA expressions found to be significant previously, with PC1 explaining a dominant 86.07% of the variance and PC2 accounting for 12.14%. Here, the separation between the two groups is more pronounced along PC1, indicating an explicit distinction in the expression profiles. The juxtaposition of these two plots highlights that specific miRNAs (marked as significant) contribute mostly to the molecular variance between the tumor and non-tumor conditions. The comparison illustrates the utility of focusing on significant miRNAs for a more targeted understanding of the molecular background of PTC.

