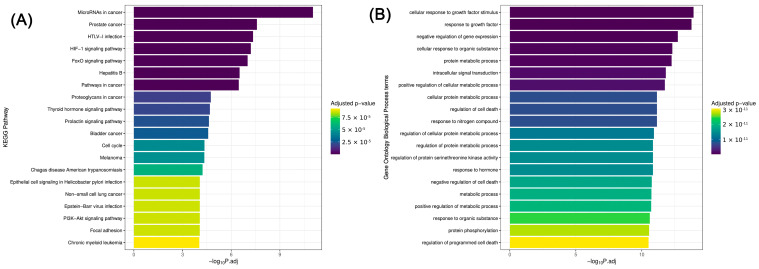
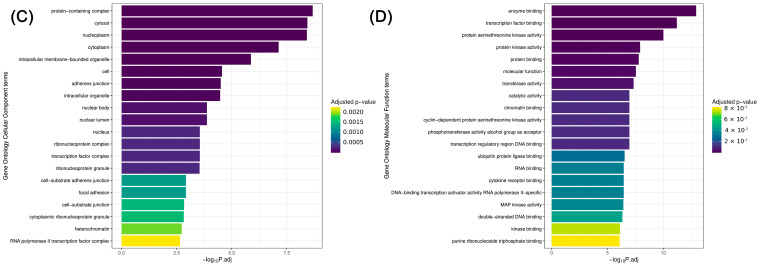
Figure 6.
KEGG and Gene Ontology (GO) enrichment analyses (ORA—over-representation analysis) based on statistically significant (p ≤ 0.05) miRNAs of this study. Associations were found between the miRNA expression patterns in PTC marked as significant and the molecular patterns of pathways (A) listed in the KEGG database as well as biological processes (B), cellular components (C), and molecular functions (D) listed in the GO database. Based on the strength of significance, the plot visualizes the top 20 molecular patterns of the KEGG and GO databases showing potential correlation with PTC. Each bar represents a pathway, a biological process, a cellular component, or a molecular function of these databases (vertical axes), with the length of the bar reflecting the significance of a possible association with PTC as indicated by the −log10 of the adjusted p-value (P.adj) (horizontal axes). The color gradient conveys the adjusted p-value, transitioning from yellow (less significant) to dark purple (more significant). The data suggest that these molecular patterns (A–D) may be influenced by the same miRNAs as the development and/or progression of PTC.


