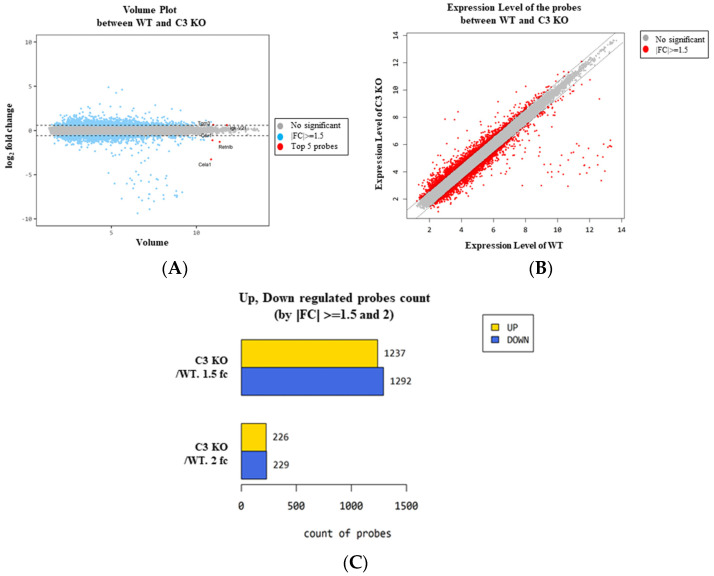
Figure 2.
Volume and scatter plots of the normalized microarray in C3 KO mice. (A) Volume plot of the WT mice and C3 KO mice. (B) Scatter plot of the WT and C3 KO mice. (C) Differentially regulated probe count. The number of genes expressed differently between WT and C3 KO mice were represented as 1.5 FC and 2 FC. Abbreviation: WT, wild type; C3 KO, complement C3 knockout; FC, fold change.

