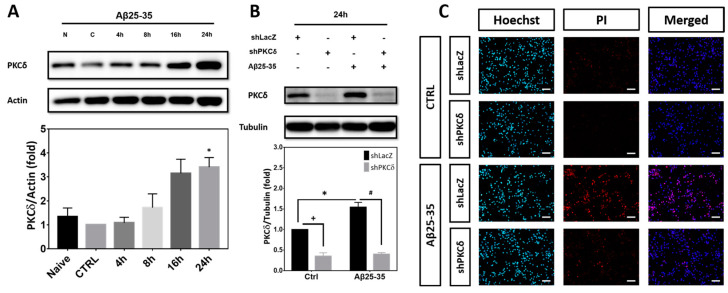
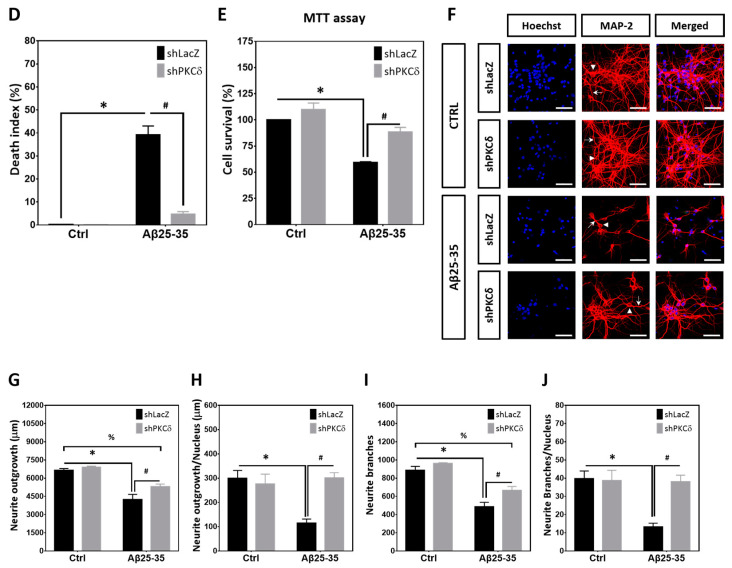
Figure 1.
PKCδ inhibition exerts protective effects against neurotoxicity induced by Aβ25-35. (A) Primary cortical cultures were treated with 10 μM Aβ25-35 for indicated times before detection of PKCδ by Western blotting. β-Actin served as the internal control for equal loading of proteins in each lane. Mean ± S.E.M. from N = 4. * denotes p < 0.05 compared with the corresponding Naïve (no treatment) and control (CTRL, treated with the same volume of vehicle ddH2O) cultures without Aβ25-35 treatment. (B) Primary cortical neurons were transfected with LacZ-shRNA or PKCδ-shRNA for 24 h, followed by exposure to 10 μM Aβ25-35 for an additional 24 h (B,F–J) or 48 h (C–E). This was followed by detection of PKCδ by Western blotting (B), determination of cell viability by Hoechst/PI double staining (C,D) or MTT assays (E), and examination of neuronal morphology (F–J). For neuronal morphology, cortical cultures were immunostained with an antibody against MAP-2 (red) to label the mature neurons; Hoechst 33258 (blue) served as the counterstaining. The arrowheads and arrows denote the representative neuronal soma and their neurites, respectively. Scale bar in (C) and (F) = 50 μm. Representative micrographs from 3 independent experiments with similar results are shown in (F). Quantitative analyses of the neurite outgrowth and neurite branch numbers are shown in (G–J). Mean ± S.E.M. from N = 4 in (B), N = 3 in (C, D), N = 4 in (E), and N = 3 in (G-J). *, #, and + all denote p < 0.05.


