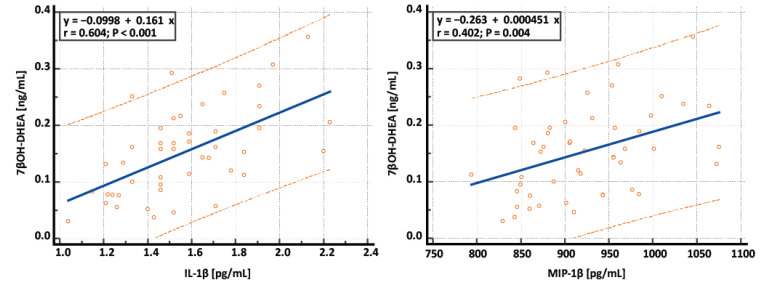
Figure 1.
Representative scatterplots showing relationships between 7β-hydroxydehydroepiandrosterone (7βOH-DHEA) and interleukin 1β (IL-1β) and 7βOH-DHEA and macrophage inflammatory protein 1β (MIP-1β). Blue lines represent regression lines, and orange dotted lines represent 95% prediction intervals.

