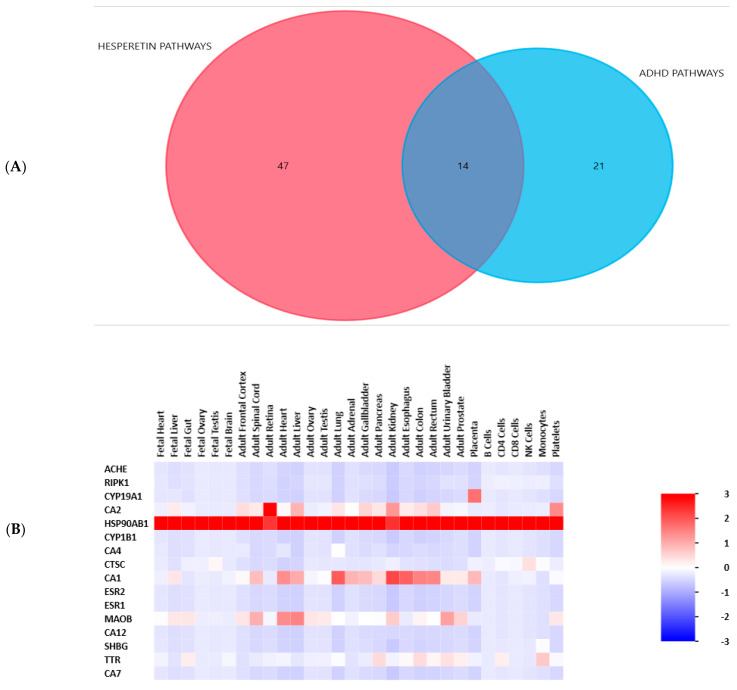
Figure 3.
(A) A Venn diagram showing the pathways related to hesperetin and to ADHD and the overlapping pathways between them. The diagram was created by the FunRich 3.1.3 bioinformatic tool. (B) A heatmap showing the pattern of gene expression of hesperetin target genes. The diagram was created by the FunRich 3.1.3 bioinformatic tool. In the color code, numbers typically range from 3 down to −3, where the values correspond to the degree of enrichment (positive values) or depletion (negative values).

