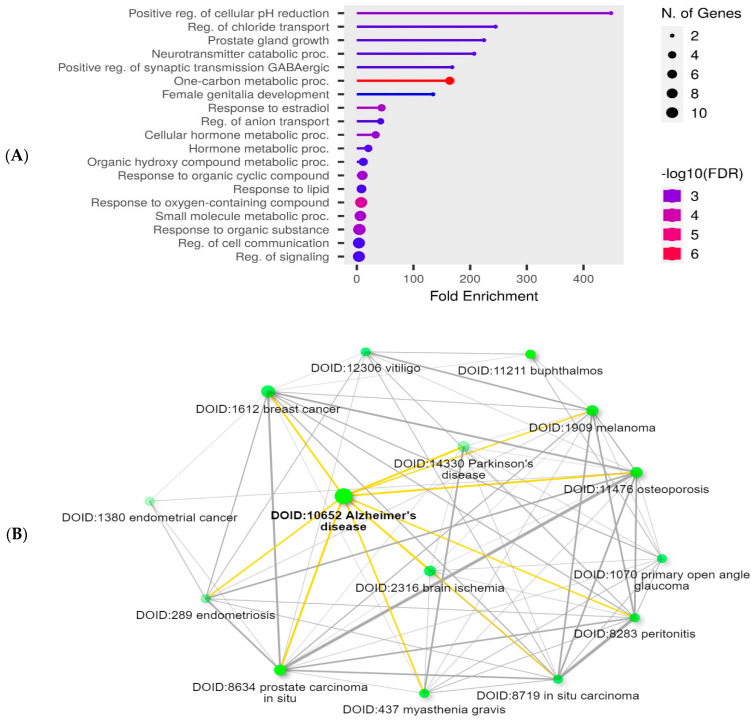
Figure 4.
(A) Lollipop chart showing the top 20 pathways of GO biological process enrichment analysis of hesperetin target genes. The chart was created with the ShinyGo 0.80 software bioinformatic tool. (B) A network displays the relationship between the enriched pathways of the hesperetin target genes according to the Disease Alliance database. Two pathways (represented by nodes) are joined if they share ≥20% of genes. The dark nodes indicate significant enrichment of the gene sets. Larger nodes symbolize larger sets of genes. The thick edges denote more overlapping between these genes. This network was created with the ShinyGo 0.80 software bioinformatic tool.

