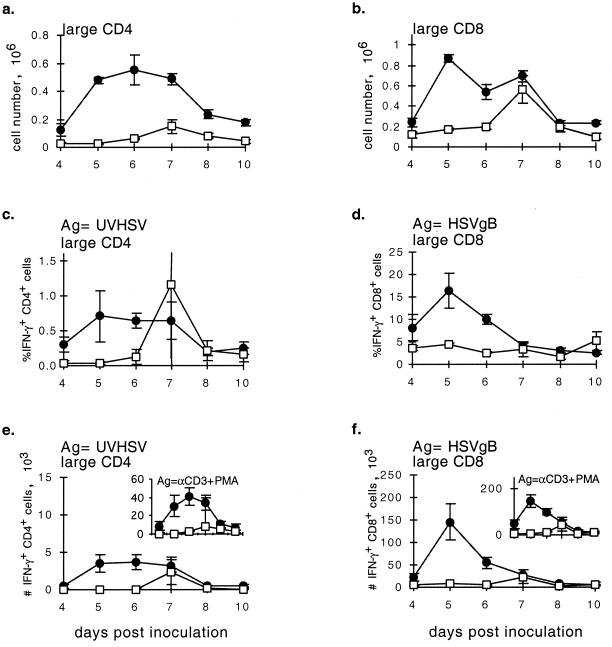
FIG. 4.
Characterization of the cellular immune response to HSV over days 4 to 10 postinoculation in CTLA4Ig-treated (□) and control (●) mice. Mice were treated and data are plotted as described for Fig. 3. ANOVA single-variant statistical analysis was used for determining significance between groups. P values: a, <0.0001; b, <0.0001; c, 0.17 (the variable CD4+ T-cell response at day 7 reflected one CTLA4Ig-treated mouse with high numbers of IFN-γ-producing cells [P < 0.0001 with censoring of this data point]; d, 0.0002; e, 0.0020; f, <0.0001.

