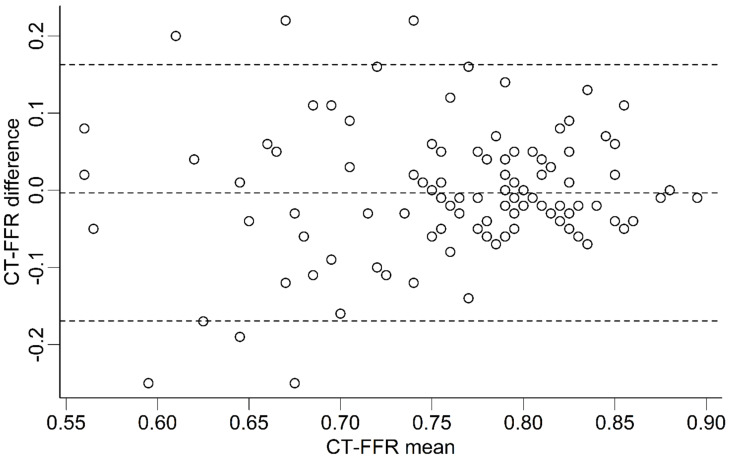
Figure 2.
CT-FFR values at patient level. Bland-Altman plot showing the distribution of differences in CT-FFR values between both observers. Differences between both observers are overall very small. The plot shows no indication of a systematic bias. Lower mean CT-FFR values show one outlier (CT-FFR difference of −0.45 at a CT-FFR mean value of 0.58), which has been omitted from the plot for clarity. Lower mean CT-FFR values also show a larger heterogeneity of CT-FFR differences. CT-FFR = CT-derived fractional flow reserve. Dashed horizontal lines represent the mean difference (middle line) and the upper and lower limits of agreement (±1.96 SD, upper and lower lines).

