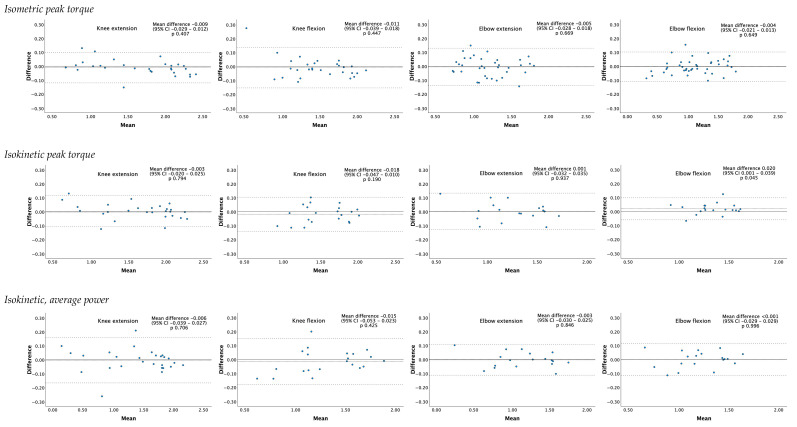
Figure 1.
Bland–Altman plots of strength and power measurements. The x-axis shows the mean score (test + retest/2), and the y-axis shows the difference between test and retest (retest–test). The horizontal straight line, at zero difference, represents no mean change between test and retest. The middle dotted line represents the mean difference between test and retest. The dotted outer lines represent the 95% limits of agreement (mean ± 1.96 SD). Each black dot represents one patient; the closer the dots are to zero, the higher the agreement between test and retest, indicating lower measurement error.

