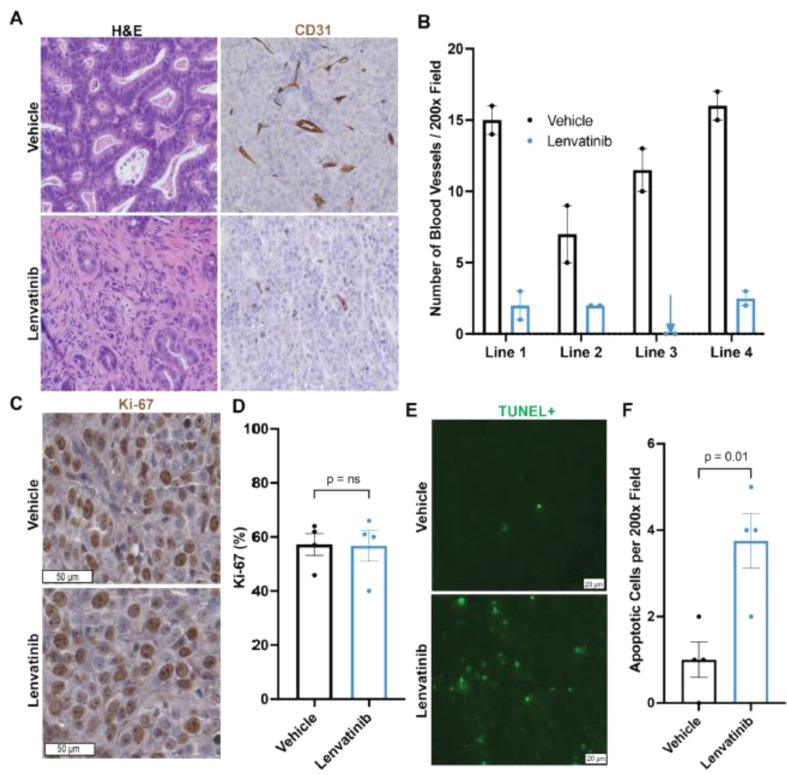
Fig. 6.
Lenvatinib treatment reduced blood vessel density and increased apoptosis in PDX tumors. A H&E and CD31 IHC of vehicle and lenvatinib-treated PDXs (200× magnification) B Intratumoral vascular density quantification. Each dot represents one tumor. The error bar represents the standard error of the mean. C Ki-67 staining of vehicle and lenvatinib-treated tumors. D Ki-67 quantification of vehicle and lenvatinib-treated tumors. Each dot represents the average Ki-67% per PDX line. The error bar represents the standard error of the mean. E TUNEL immunofluorescence staining of vehicle and lenvatinib-treated tumors. F Quantification of TUNEL-positive cells. Each dot represents the average TUNEL-positive cells per PDX line. The error bar represents the standard error of the mean

