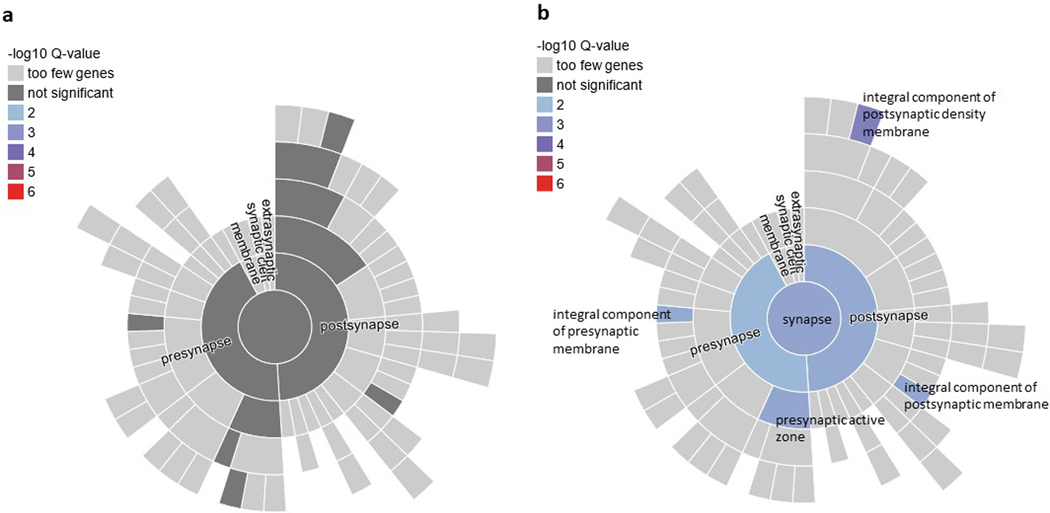
Extended Data Figure 6: PTSD genes in SynGO.
Sunburst plots show enrichment of PTSD-related genes in SynGO cellular components. The synapse is at the center ring, pre- and post-synaptic locations are at the first rings, and child terms are in subsequent outer rings. a, enrichment test results for all 415 genes mapped to PTSD GWAS loci by FUMA from one of three gene-mapping strategies (positional, expression quantitative trait loci, and chromatin interaction mapping). b, enrichment test results for 43 genes prioritized into Tier 1 using a gene prioritization strategy. Plots are colored by -log10 Q-value (see color code in the bar at left) from enrichment of PTSD genes relative to a brain expressed background set.

