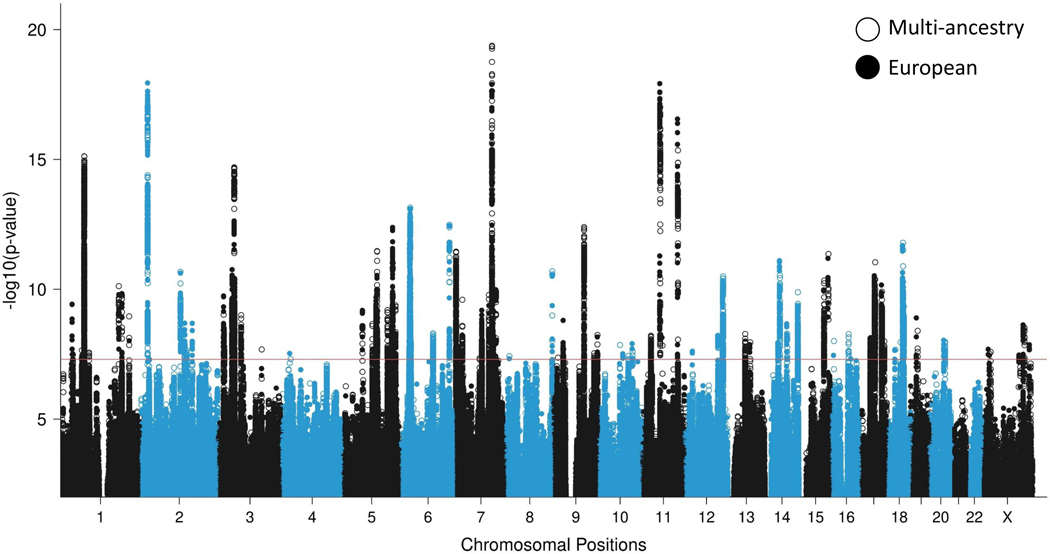
Figure 2 |. GWAS meta-analyses in European and multi-ancestry individuals identify a total of 95 PTSD risk loci.
Overlaid Manhattan plots of European ancestry (EA; 137,136 cases and 1,085,746 controls) and multi-ancestry meta-analyses (150,760 cases and 1,130,173 controls), showing 81 genome-wide significant (GWS) loci for the EA (full circles) and 85 GWS loci for the multi-ancestry (hollow circles) analyses. Circle colors alternate between chromosomes, with even chromosomes colored blue and odd chromosomes colored black. The y-axis refers to −log10 P-values from two-sided z-tests for meta-analysis effect estimates. The horizontal red bar indicates the threshold for GWS associations (P < 5 × 10⁻⁸).

