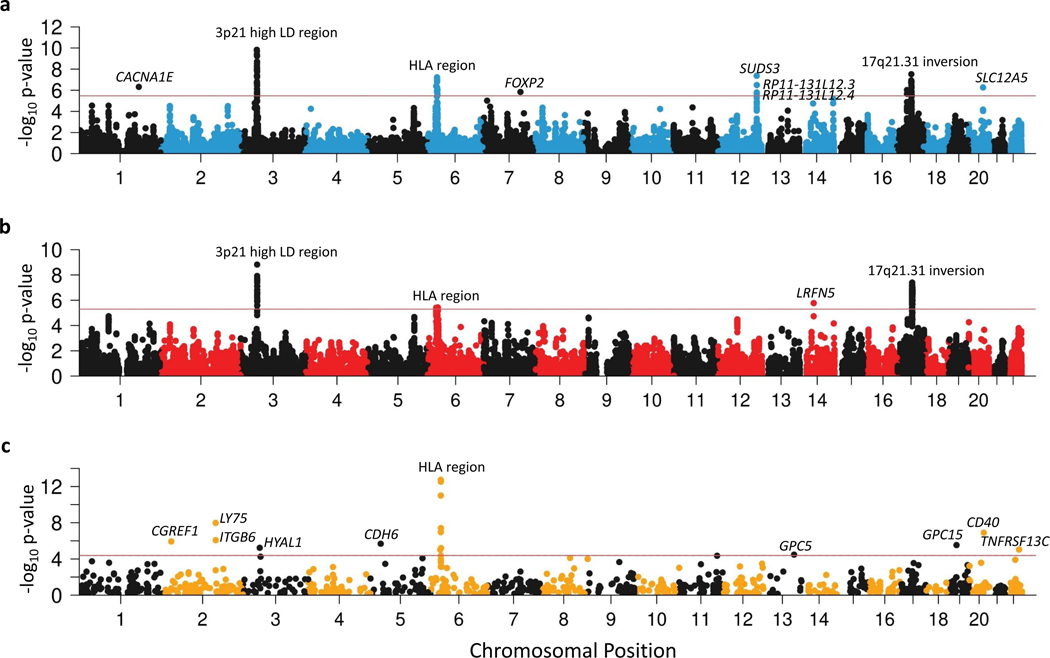
Figure 3 |. Manhattan plots of PTSD associations in multi-omic analyses.
a,b, Gene expression data from 13 brain tissue types and the pituitary were used to conduct transcriptome-wide association study (TWAS) identifying 9 loci with differential expression between PTSD cases and controls (a) and expression quantitative trait locus summary based Mendelian randomization (eQTL SMR) identifying 4 loci where gene expression has putative causal effects on PTSD (b). c, Blood protein quantitative trait locus (pQTL) SMR identify 16 blood proteins whose abundance has a putative causal effect on PTSD. The y-axis refers to −log10 P-values from two-sided z-tests for TWAS, two-sided Chi-square tests for eQTL SMR, and two-sided Chi-square tests for pQTL SMR. The horizontal red bars indicate gene-wide significance (P < 0.05/14,935 for TWAS, P < 0.05/9,903 for eQTL SMR, and P < 0.05/1,209 for pQTL SMR). Significant findings are labeled.

