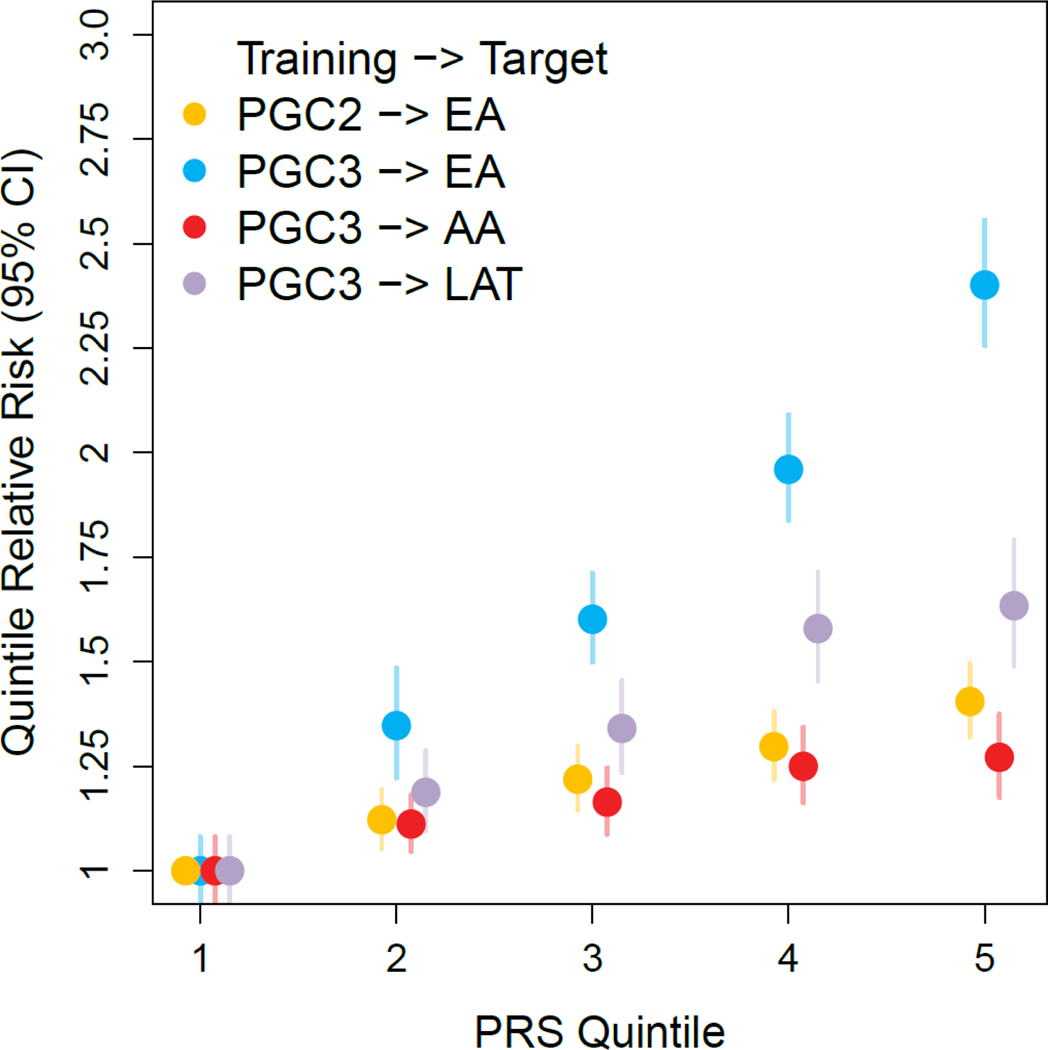
Figure 5 |. Polygenic risk score analysis for PTSD across different data sets and ancestries.
PGC-PTSD Freeze 2 and Freeze 3 European ancestry (EA) based genetic risk score (PRS) predictions into independent samples of different ancestries. The y-axis represents PTSD risk relative to the lowest quintile of PRS with 95% confidence intervals. For EA, predictions based on Freeze 3 training data (10,334 cases and 55,504 controls; blue circles) demonstrate a significant performance increase compared to predictions based on the previous Freeze 2 training GWAS11 (yellow circles). Based on Freeze 3 EA training data, EA individuals in the highest quintile of PRS have 2.40 (95% CI = [2.26,2.56]) fold the risk of PTSD relative to individuals in the lowest quintile PRS (blue circles). Lower prediction accuracies are found for individuals of African (AA; 10,151 cases and 22,420 controls; red circles) and Native American (LAT; 5,346 cases and 10,821 controls; purple circles) ancestries, indicating poor PRS transferability across ancestries.

