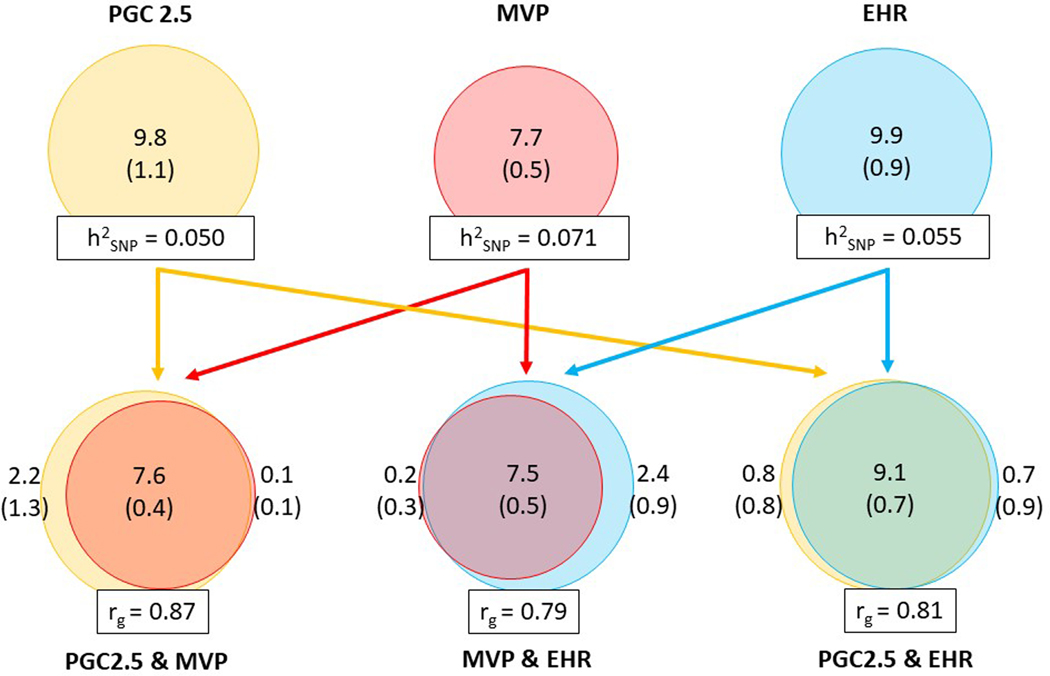
Extended data Figure 1: Comparison of the genetic architecture of PTSD in the three main data sources.
Quantification of polygenicity and polygenic overlap in the three main data subsets based on (1) symptom scores in clinical studies and cohorts assessed on a variety of instruments in Freeze 2.5 (yellow; 26,080 cases and 192,966 controls), (2) PCL (for DSM-IV) based symptom scores in the MVP (red; 32,372 cases and 154,317 controls), and (3) ICD9/10 codes in EHR studies (blue; 78,684 cases and 738,463 controls) indicate a similar genetic architecture. The circles on the top half of the plot depict univariate MiXeR estimates of the total polygenicity for each data subset. Numbers within circles indicate polygenicity values, expressed as the number of variants (in thousands, with SE in parenthesis) necessary to explain 90% of SNP based heritability (h2SNP). h2SNP estimates are written in the boxes at the bottom of the circles. The Euler diagrams on the bottom half of the plot depict bivariate MiXeR estimates of the polygenic overlap between data subsets. Values in the overlapping part of the Euler diagrams denote shared polygenicity and values on the non-overlapping parts note dataset-specific polygenicity. Genetic correlations (rg) between dataset pairs are noted in the boxes below the Euler diagrams. Arrowed lines are drawn between univariate and bivariate results to indicate which dataset pairs are being evaluated. Abbreviations: Neff, effective sample size.

