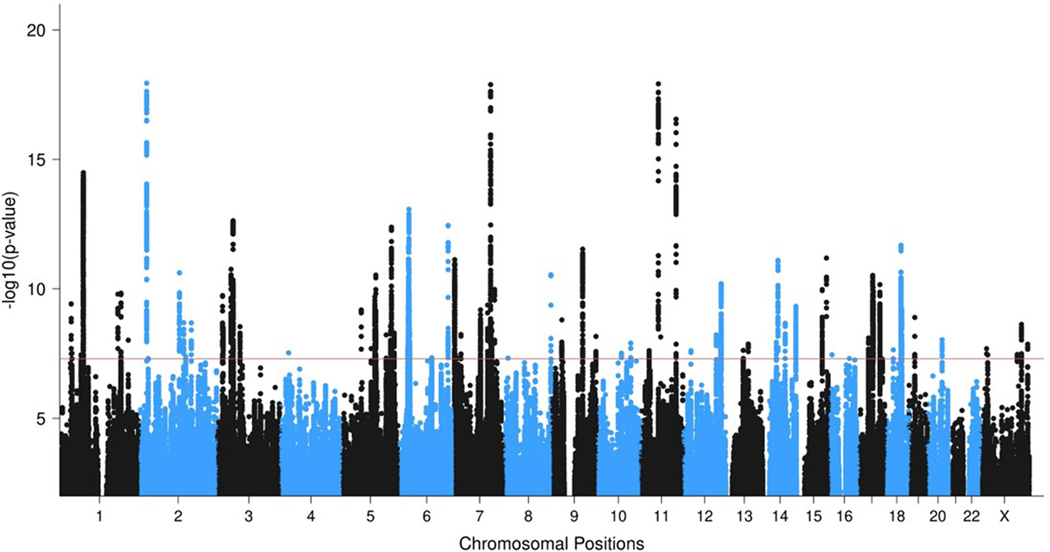
Extended data Figure 2: Manhattan plot of the PTSD GWAS meta-analysis in individuals of European ancestry (EA).
Results of the EA GWAS meta-analysis (137,136 PTSD cases, 1,085,746 controls) identifying 81 genome-wide significant PTSD loci. The y axis refers to the −log10 p-value from a meta-analysis using a sample size weighted fixed-effects model. Circle colors alternate between chromosomes: even chromosomes are colored blue and odd chromosomes are colored black. The horizontal red bar indicates genome-wide significant associations (p < 5×10⁻⁸).

