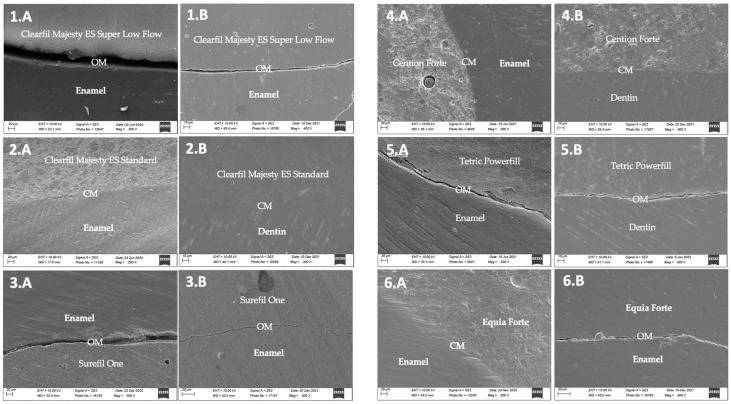
Figure 4.
Representative micrographs of different marginal situations observed with the different materials. (1.A) Samples from group 1. SEM micrographs of enamel and Clearfil Majesty ES Super Low Flow margins after thermomechanical loading. See the open margins (OM). (1.B) Sample from group 1. SEM micrographs of enamel and Clearfil Majesty ES Super Low Flow internal adaptation after thermomechanical loading. See the open margins (OM). (2.A) Sample from group 2. SEM micrographs of enamel and Clearfil Majesty ES Standard margins after thermomechanical loading. See the continuous margins (CM). (2.B) Sample from group 2. SEM micrographs of dentin and Clearfil Majesty ES Standard internal adaptation after thermomechanical loading. See the continuous margins (CM). (3.A) Sample from group 3. SEM micrographs of enamel and Surefil One margins after thermomechanical loading. See the open margins (OM). (3.B) Sample from group 3. SEM micrographs of enamel and Surefil One internal adaptation after thermomechanical loading. See the open margins (OM). (4.A) Samples from group 4. SEM micrographs of enamel and Cention Forte margins after thermomechanical loading. See the continuous margins (CM). (4.B) Samples from group 4. SEM micrographs of enamel and Cention Forte internal adaptation after thermomechanical loading. See the continuous margins (CM). (5.A) Samples from group 5. SEM micrographs of enamel and Tetric Powerfill margins after thermomechanical loading. See the open margins (OM). (5.B) Samples from group 5. SEM micrographs of dentin and Tetric Powerfill internal adaptation after thermomechanical loading. See the open margins (OM). (6.A) Sample from group control. SEM micrographs of enamel and Equia Forte internal margins after thermomechanical loading. See the open margins (OM). (6.B) Sample from group control. SEM micrographs of enamel and Equia Forte internal adaptation after thermomechanical loading. See the open margins (OM).

