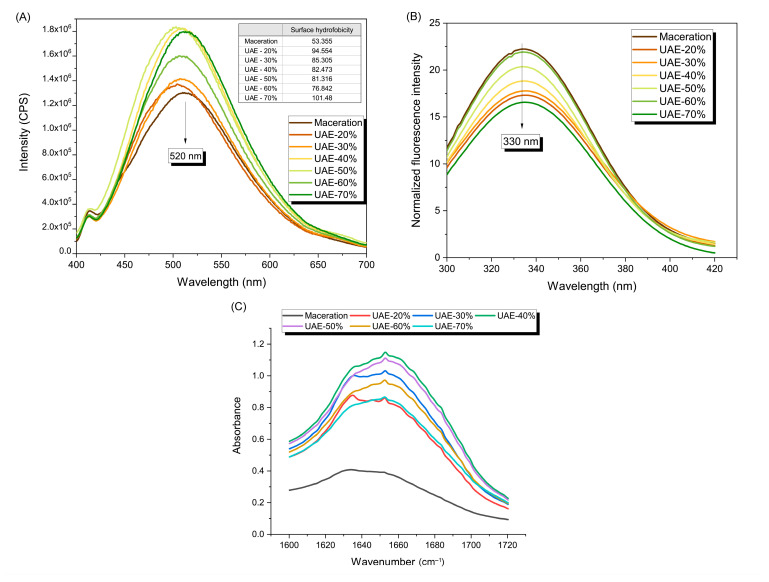
Figure 4.
Fluorescence emission spectra and surface hydrophobicity values (A) and intrinsic tryptophan fluorescence spectra (B), which indicate tertiary structural differences between proteins extracted via maceration and ultrasound-assisted extraction influenced by different amplitudes. ATR-FTIR spectra of the characteristic amide I region (C) which demonstrates the changes in the secondary structure of extracted proteins. Legend: UAE-20%, UAE-30%, UAE-40%, UAE-50%, UAE-60%, and UAE-70% mean ultrasound-assisted extraction process at 20, 30, 40, 50, 60, and 70% amplitudes, respectively.

