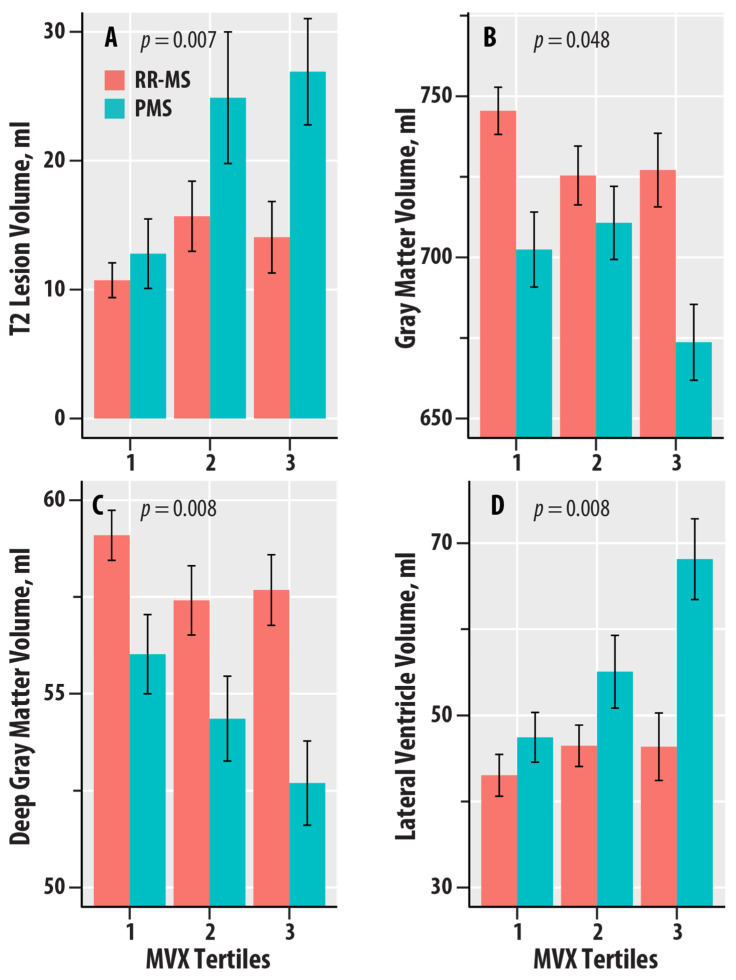
Figure 3.
Dependence of T2 lesion volume (in ml, A), gray matter volume (in ml, B), deep gray matter volume (in ml, C), and lateral ventricle volume (in ml, D) on tertiles of the Metabolic Vulnerability Index (MVX) in relapsing–remitting MS (RR-MS, salmon bars) and progressive MS (PMS, teal bars). The bars represent mean values, and the error bars are standard errors. The regression p-values for IVX, MMX, and MVX from Table 4 are shown.

