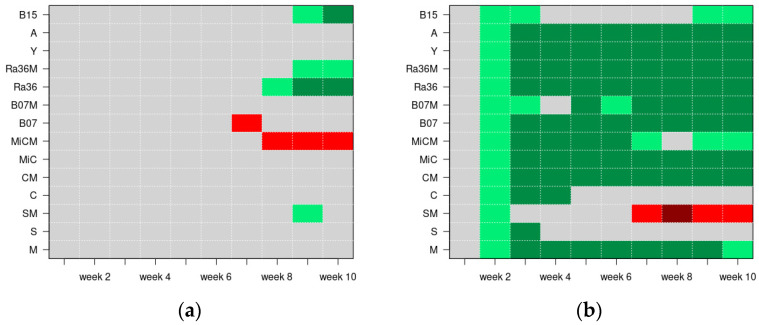
Figure 4.
The levels of significance of the Z tests, across the ten weeks, under the experimental conditions with only tap water (a) and with the addition of NaCl (b): the pixels in dark green and dark red show the CIRs, respectively, lower or higher than the control CIRs (significance 0.001); the pixels in light green and light red show the CIRs, respectively, lower or higher than the control CIRs (significance 0.01); and the pixels in gray show no significant difference between the treatment and control CIRs. Legend: M = molasses; S: soil; SM = S + M; C = compost; CM = C + M; MiC = micro compost mix; MiCM = MiC + M; B07 = B. amyloliquefaciens strain B07; B07M = B07 + M; Ra36 = R. aquatilis strain 36; Ra36M = Ra36 + M; Y = P. terrestris strain PT22AV; A = Activeg; B15 = Bioalga 15.

