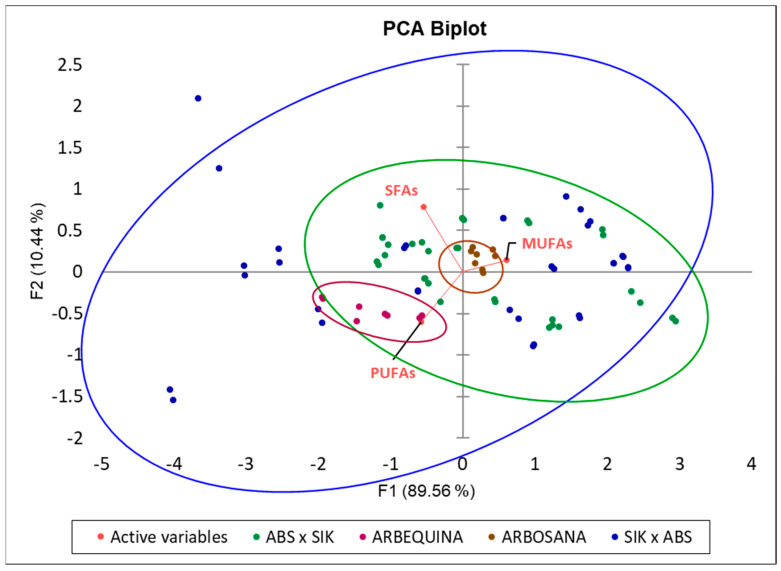
Figure 4.
Principal component analysis (PCA) displaying the fatty acid profile variation (loadings: SFAs: saturated fatty acids; MUFAs: monounsaturated fatty acids; PUFAs: polyunsaturated fatty acids) in all the samples analyzed (scores represented by dots). Each cultivar and each reciprocal cross (SIK—‘Sikitita’; ABS—‘Arbosana’) are represented by a specific color. The ellipses represent the distribution and tendencies of the samples and the clustering of each genotype or reciprocal cross group of samples.

