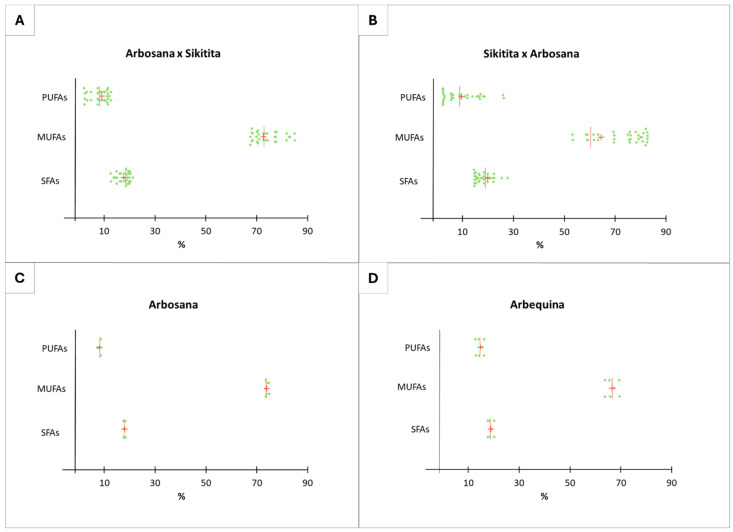
Figure 5.
Olive oil fatty acid variability represented in the dot plot graph from the reciprocal cross ‘Arbosana’ × ‘Sikitita’ (A), ‘Sikitita’ × ‘Arbosana’ (B), the reference cultivar ‘Arbosana’ (C), and the reference cultivar ‘Arbequina’ (D). Each dot represents a sample analyzed for a given trait, the red vertical line represents the median, and the red cross represents the mean. (SFAs: saturated fatty acids; MUFAs: monounsaturated fatty acids; PUFAs: polyunsaturated fatty acids).

