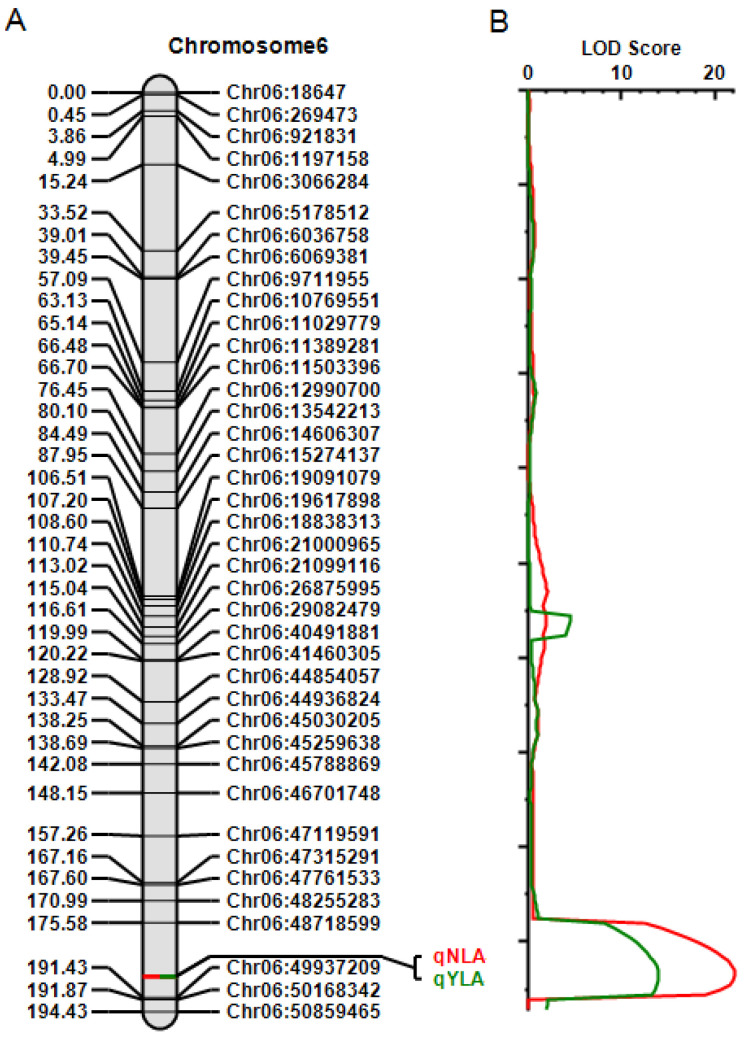
Figure 5.
Quantitative trait loci (QTL) identified by inclusive composite interval mapping for NLA and YLA on chromosome 6 using a population of 226 F2 plants derived from a cross between Williams 82 (resistant to the BP isolate IBS 333) and PI 416937 (susceptible). (A) Genetic map of chromosome 6 with the position of the QTLs for the NLA and YLA. The genetic positions (cM) are represented on the left, with the GBS markers, corresponding to physical positions of the Williams 82 assembly (Gmax_275_Wm82.a2.v1), on the right. (B) LOD scores for the QTLs for NLA (red) and YLA (green). Only peaks between Chr06:48,718,599 and Chr06:49,937,209 were significant at the 5% level by the 1000-permutation test.

